How does Vianova use MDS to help operators collaborate with municipalities?
October 25, 2021
min. read


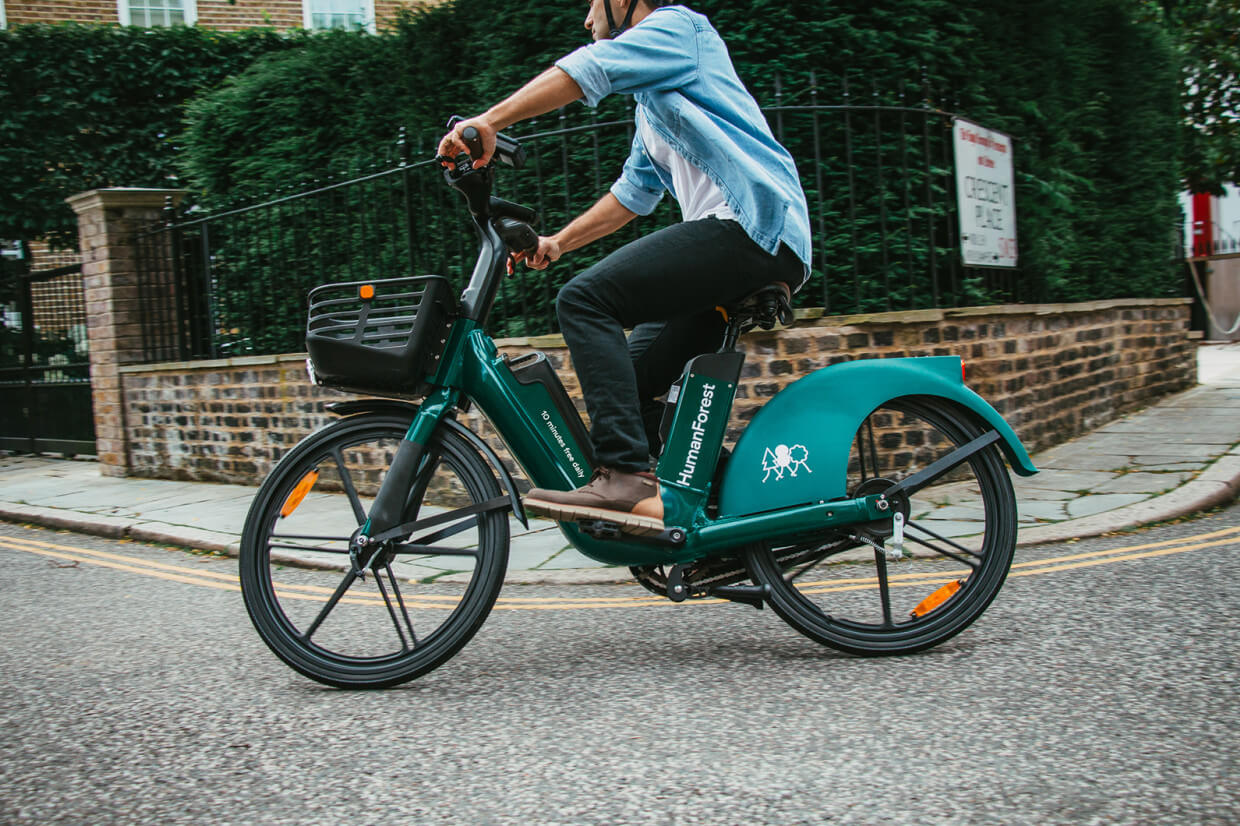
With the increasing demand for different mobility solutions and their increasing availability, municipalities are the first institutions to benefit from all these new ideas and service providers. Mobility Data Specification (MDS) is a digital tool created for their convenience. It helps municipalities to improve their management of public transportation. This tool is used by ATOM Mobility and many large micro-mobility operators to share ride and vehicle data. This time though the story is about Vianova, a company that goes a step further. This platform aggregates data from many operators and makes them available to municipalities in a visualized form that is easy to understand.
Every municipality should create the right mobility mix for its city. Usually, this is in order to rapidly replace individual cars. Interest from micro-mobility service providers is being regulated by cities with permits, tenders, and continually changing regulations, because, in relation to available parking places and safety, municipalities need to manage public spaces. However, fear of the potential mess resulting from free-floating micro-mobility still exists. What is the right number of vehicles that a city can afford to have? Operators are not interested in short-term collaborations, so what can they expect in the long term? They should plan their business ahead and they can even bring more added value to the city, for example, if they know that they can rely on integrating new means of transportation.
Towards better communication
Vianova is the leading mobility intelligence platform in Europe. The company provides mobility intelligence and mobility management tools to both cities and operators. It is possible for municipalities to see aggregated data from different mobility operators on dashboards so they can understand the utilization of services set up according to regulations. In addition, this data can be easily shared with operators and supervise fleet deployment in the city. “We've seen that this transparency and trust facilitates more direct communication that leads to better collaboration between operators and cities striving to deploy micro-mobility,” says Thibault Castagne, Co-Founder & CEO of Vianova.
Based on the data available, municipalities can plan new infrastructure deployments, draw up the right policies, and integrate micro-mobility into the overall mobility mix. This all can be done with the help of the appropriate analytics. “It is important to understand when, where and what vehicles are located to set up geofencing and mobility hubs, etc. Moreover, those in charge should make sure that everything works properly. In regard to safety - is the infrastructure set up in the right manner? Is there a need for new cycling lanes or speed limits? The mix of sustainability and mobility is really about understanding how these new services can be integrated into the city’s overall multimodal transport system and this is accomplished by understanding origin and destinations, interconnection with public transport, and so on. It can be achieved by sharing data,” says Thibault.
Creating regulations on the spot
The Vianova dashboard is available in a web app so it can be used on any web browser. Anyone with access can see the city view with all providers aggregated on one dashboard. If required, operators can even be contacted via the dashboard. City operators can keep track of violations. It is also possible to see fleet availability and vehicle rotation by district, sub-district, and even keep track of fleet size per provider.
“One very interesting feature is creating regulations,” explains Thibault. “It is possible to create new regulations straight on the map, for example, additional no-go zones. City representatives just have to click “plus” and indicate “I want to create a low-speed zone”. It will be possible to draw a particular zone that will be directly shared with operators. They will then receive an API. Through this API they will be able to continuously receive the city’s new regulations in a digital, machine-readable format that is easy to integrate with fleet management software.” In addition, full analytics reports are available detailing the number of trips per provider, the fleet size per provider, the device rotation and fleet availability, etc.
Operators can see their own mobility insights as well as regulations. They can obtain information about trips, helping them to identify what the most popular origins and most popular destinations are. Moreover, this data is even available for the last six months.
Here are a couple of examples of how cities took the insights provided by Vianova and turned them into very successful infrastructure changes. In Brussels, the city government uses trip telemetry to understand which routes are used by e-scooters and e-bikes the most all around the city. The new cycling lanes that were built after the investigation resulted in a five-fold increase in micro-mobility trips. A similar project that involved planning and management was implemented in Stockholm. New parking racks were built using data that helped to plan the installation, management, and availability.
Equal rights for everyone
However, even with the best data available for all parties, the question arises - is the competition between big micro-mobility players in the market like Void, Lion Bird, Spin, and small service providers fair? Is it even possible for smaller companies to enter the market? Thibault thinks that this is the toughest part of the discussion for municipalities. However, for small market players, it is not that complicated: “The truth is that the difference is not that big. I think that small operators should also show their track record or previous use cases of fleet operations, as well as demonstrate good collaboration with cities. This can provide these companies with the mandate to take part in this micro-mobility service competition. Furthermore, I think that smaller operators could be a better partner for the city because they turn out to be more focused on delivering the right service for that specific city.”
Vianova is a great partner for both operators and cities. The platform offers valuable insights that cities can then use to make their surroundings more sustainable and green by welcoming micro-mobility in a controlled manner.
Interested to learn more about MDS or Vianova? Reach out to our sales team: https://atommobility.com/demo
🚲 🛴 E-scooters or e-bikes? Docked or dockless? Every vehicle choice shapes the success of your micromobility business. In this new article, we break down the key micromobility fleet vehicles – their features, best use cases, and how to match them to your city profile. Plus, how ATOM Mobility helps operators manage both scooter and bike fleets in one platform.
Operators entering the micromobility space today face one major early decision: which vehicles to deploy. Your fleet type affects user experience, operational costs, maintenance needs, and regulatory compliance. Whether you plan to launch e‑scooters, e‑bikes, mopeds, or a mixed fleet, each vehicle category serves a different purpose.
This guide covers the main micromobility fleet vehicles – bike, e‑bike, kick scooter, e‑scooter, moped, and e‑moped – along with their features, common manufacturers, docking options, and ideal use cases.
Understanding the vehicle types
Bike (mechanical bicycle) A standard pedal bicycle with no motor. In shared fleets, mechanical bikes are simple, durable, and cost‑efficient. They require minimal electronics and are ideal for cities with strong cycling infrastructure. They generate lower maintenance costs but depend entirely on rider effort. Normally, user demand for this type of bike is also lower, thus operators can expect lower RPV rate (rides per vehicle per day).
E‑bike (electric bicycle) An electric bike combines pedal power with an electric motor that assists the rider. E‑bikes allow longer trips, easier hill climbing, and broader user appeal. Typical shared e‑bike trips range between 5–10 km. They cost more upfront but often generate higher revenue per ride. Many fleet operators source models from manufacturers such as Segway‑Ninebot, Okai, and Yadea. You can explore available e‑bike hardware options on the ATOM Mobility vehicles page: https://www.atommobility.com/vehicles.
Kick scooter (non‑electric scooter) A kick scooter is manually powered by pushing off the ground. While less common in commercial shared fleets today, they are still used in some controlled campus or tourism environments where low speed and low complexity are priorities.
E‑scooter (electric scooter) E‑scooters are lightweight, battery‑powered vehicles designed for short urban trips, typically under 4 km. They are highly flexible and well suited for dense city centers and first‑mile/last‑mile transport. Modern fleet models include swappable batteries, improved braking systems, suspension upgrades, and integrated IoT modules. Popular manufacturers include Segway‑Ninebot, Okai, and Navee that can also be found at ATOM Mobility.
Moped (fuel‑powered light motorcycle) A moped is a small motorized vehicle traditionally powered by gasoline, offering higher speeds and longer range than bikes or scooters. In shared mobility, fuel mopeds are becoming less common due to emissions regulations but still operate in some regions.
E‑moped (electric moped) An e‑moped is an electric version of a traditional moped. It provides longer range and higher speed than e‑scooters, often up to 45 km/h depending on local regulations. E‑mopeds are ideal for suburban areas or cities with longer commuting distances. Manufacturers such as NIU, Silence, Super Soco, and Yadea dominate this segment.
The table below provides a general comparison of the most common shared mobility vehicle types, including typical purchase prices, expected service life in commercial fleets, and average utilization (rides per vehicle per day). Actual figures vary depending on manufacturer, market, operating conditions, and fleet maintenance.
Approx. new purchase price – The typical cost of purchasing a new commercial-grade vehicle for a shared mobility fleet. Prices vary depending on the manufacturer, hardware specifications, battery capacity, IoT integration, and fleet order size.
Approx. used purchase price – The typical market price of a pre-owned commercial vehicle suitable for shared mobility operations. Factors such as vehicle age, mileage, battery health (for electric vehicles), overall condition, and refurbishment status significantly influence the price.
Typical fleet lifespan – The average period a vehicle remains economically viable in a shared mobility fleet before being retired or replaced. Lifespan depends on ride frequency, maintenance quality, weather conditions, road infrastructure, vandalism, accidents, and how intensively the fleet is operated.
Average rides/day/vehicle (RPV) – Rides Per Vehicle per Day (RPV) is one of the most important performance metrics for shared mobility operators. It measures the average number of completed trips each vehicle performs daily. Higher RPV generally leads to better fleet utilization, faster return on investment, and improved profitability. Actual RPV varies depending on vehicle type, city size, demand, seasonality, pricing strategy, fleet availability, and operational efficiency.
Docked vs dockless infrastructure
Beyond vehicle choice, parking strategy matters. Dockless fleets offer flexibility but may create parking compliance challenges. Docked systems use physical stations that improve order, security, and charging efficiency.
Several manufacturers specialize in docking and locking infrastructure, including KNOT CITY (which recently is out of market), and Kuhmute. These docking systems can improve vehicle organization, reduce vandalism, and simplify charging logistics for e‑bikes and e‑mopeds.
E‑scooters: Best for dense urban zones
E‑scooters work best in compact city centers, student districts, and areas with high short‑trip demand. They require less parking space and are faster to deploy. However, they demand consistent maintenance and battery management.
E‑bikes: Broader demographic appeal
E‑bikes provide greater comfort and stability, making them suitable for older users, tourists, and riders carrying bags. They perform well in cities with established cycling lanes or moderate hills. Although more expensive than scooters, they often achieve longer ride durations and stronger customer loyalty.
E‑mopeds: Extended range and higher revenue potential
E‑mopeds are suitable for cities with wider geography or suburban commuting patterns. They typically deliver higher revenue per trip but require licensing compliance and more robust fleet management.
Matching vehicles to city profiles
Tourist cities often benefit from e‑bikes due to comfort and sightseeing suitability. College towns frequently lean toward e‑scooters because of affordability and convenience. Larger or hilly cities may support mixed fleets. Suburban zones often justify e‑mopeds for longer travel distances.
Climate also influences hardware decisions. Wet or cold regions require sealed wiring, water‑resistant components, and tires suitable for slippery conditions.
Planning your hardware strategy
Choosing the right fleet is not only about vehicle type. It involves sourcing reliable manufacturers, evaluating docking options, understanding regulatory requirements, and planning maintenance cycles. Reviewing available hardware categories through ATOM Mobility’s vehicles directory can help operators compare models and integrations before committing to a large fleet purchase.
The most successful operators treat fleet composition as flexible. They start with one category and expand based on usage data, seasonality, and rider behavior. A balanced hardware strategy allows adaptation without replacing the entire fleet.
ATOM Mobility supports mixed fleets – including e‑scooters, e‑bikes, and e‑mopeds – within one platform, covering booking, payments, hardware integrations, and analytics. This allows operators to scale gradually while maintaining operational control.
Vehicle choice is not static. As cities evolve and regulations tighten, operators who understand their hardware options and adapt quickly are better positioned for long‑term growth.
🚕 Getting drivers on the road is not the only thing you need to launch your taxi business. Many new platforms struggle with the same problem – drivers with no demand and riders with no available drivers. Building both at the same time is where most launches fail. This article introduces the key steps to launch a taxi business and avoid the most common mistakes.
Launching a taxi business today takes more than having drivers. It requires a system that can attract riders, onboard drivers, manage bookings, process payments, and keep daily operations running smoothly as demand grows.
The ride-hailing market is growing fast, while customer acquisition is getting more expensive and more competitive. Technavio estimates the global ride-hailing market will grow by more than $102 billion between 2024 and 2029, which creates room for new operators, but also raises the cost of visibility, paid acquisition, and brand differentiation in crowded markets, according to this ride-hailing services market forecast.
Many operators now launch faster by using ready-made tools instead of building every part from scratch. ATOM Mobility has already helped operators launch mobility businesses in as little as 90 days through a phased rollout covering market validation, legal setup, branding, driver onboarding, and launch execution.
But how to actually launch your business, if you’re not willing to do everything from scratch?
Most taxi businesses do not fail because the app is missing a feature but because there is no clear reason for customers to switch. Before choosing software or recruiting drivers, define where your opportunity is. That could mean:
This matters more than most expect. Your pricing, branding, driver experience, and customer acquisition all depend on the niche you choose. That is why defining a clear angle early matters, especially in crowded markets.
A taxi business is still a regulated business. Before launch, you need to set up the basics properly:
Skipping this part slows everything down later.
This is also the stage where many founders underestimate operating costs. Beyond software, you will need to plan for driver incentives, support, payment processing, and customer acquisition. That is one reason many operators now launch with white-label software instead of funding a custom build from day one.
Building a taxi app from scratch is expensive (in many cases we see it costs more than 30 000 -50 000 EUR), slow (takes many monhts), and usually unnecessary. To launch a working taxi business, you need:
Most early-stage operators do not need to build these systems themselves but a working infrastructure they can brand and launch quickly. That is why many operators start with ATOM Mobility, where the full system already includes rider and driver apps, dispatch tools, payments, analytics, integrations and backend operations in one platform. This is the same logic behind building a branded taxi service with white-label software instead of spending months on custom development.
Driver onboarding needs to be fast and easy enough that drivers can register, upload documents, get approved, and start working without delays. But if onboarding takes too long, drivers drop off before they complete their first ride.
A strong launch setup should include:
This is also where the ATOM Mobility driver app becomes important, since it gives drivers one place to accept rides, navigate, manage earnings, and stay active without switching between tools.
Many taxi businesses still focus only on app installs but that is a mistake. Not every rider wants to download an app before booking a ride. This is especially true for airport pickups and tourists in general, hotel guests, older riders, and occasional users. That is why booking flexibility is important. Alongside mobile apps, many operators now add browser-based booking so riders can order without installing anything.
This is what ATOM introduced with its Web Booker for ride-hail, which gives operators a simple way to capture web traffic, direct bookings, and one-time users without forcing an app download.

You need both, drivers and riders, to be interested in your service from day one – drivers will not stick around without rides and riders won’t pick you if there are no available drivers.
That means:
This is one reason local launches tend to perform better than city-wide launches. Smaller launch zones create stronger supply-demand density and better first user experience.
Most taxi businesses fail because not enough people know they exist, not because they lack great technology. Founders often spend months building operations, then treat marketing as something to figure out later, which can become an aspect in which the expenses start rising fast.
You need:
ATOM now offers a dedicated marketing agency for mobility businesses, built specifically for operators who need help acquiring riders, running paid campaigns, and building predictable demand. Without consistent rider acquisition, even a strong product struggles.
Many operators launch with taxis first, then expand into extra services once demand is stable.
That could mean:
This is one of the strongest advantages of launching on flexible mobility software. You are not building a single-use taxi app but a mobility platform that can grow. That is also why ATOM’s ride-hailing platform was built to integrate with broader shared mobility services instead of staying limited to one transport model.
If you’re launching a taxi business, building the right system usually is more important than building a software from scratch. The strongest operators start with a clear market gap, launch with ready-made tools, onboard drivers quickly, give riders flexible booking options, and invest in demand early.
Driver App demo credentials - Email: test@atom.com, Password: driver

