Blog
Insights and news from the ATOM Mobility team
We started our blog to share free valuable information about the mobility industry: inspirational stories, financial analysis, marketing ideas, practical tips, new feature announcements and more.

We started our blog to share free valuable information about the mobility industry: inspirational stories, financial analysis, marketing ideas, practical tips, new feature announcements and more.
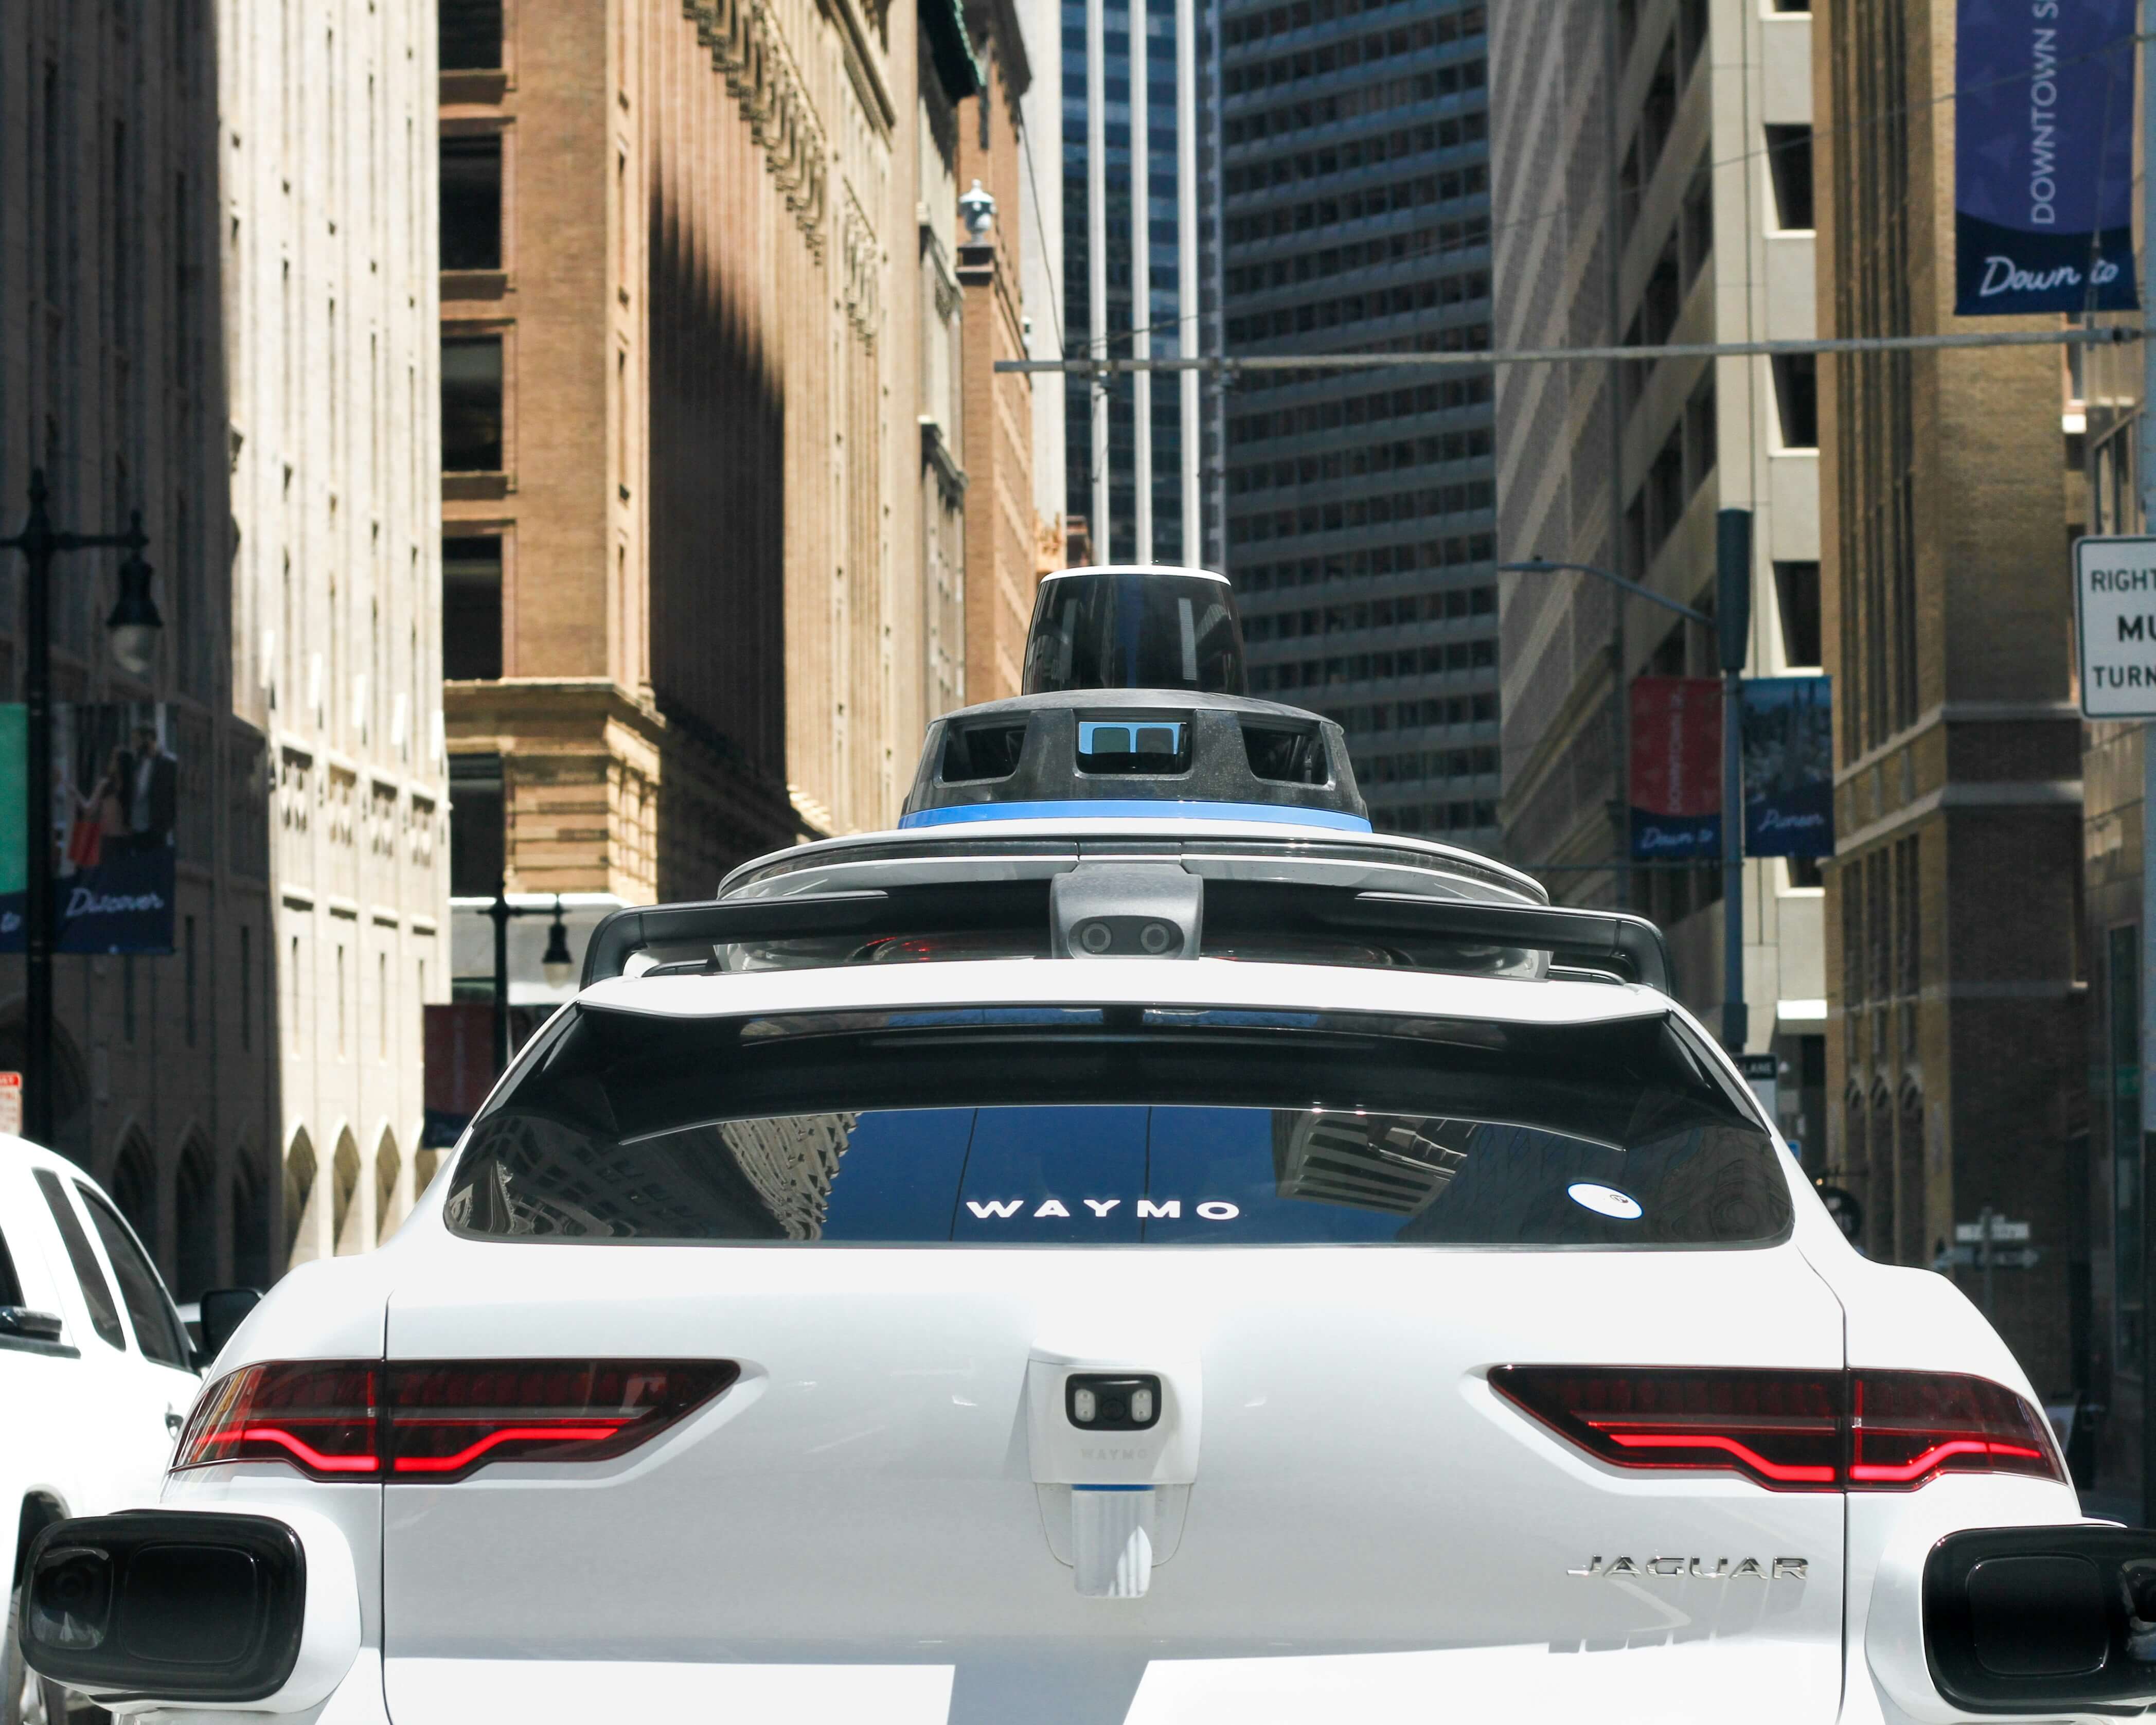
🤖 Who will actually operate Europe’s robotaxi fleets? Autonomous driving may remove the driver, but it doesn’t remove the work behind the car. Robotaxis still need charging, cleaning, maintenance, depots, customer support and someone managing the fleet every day. Early projects in Zagreb, Madrid and London illustrate different stages of deployment and how AV technology providers, fleet operators and booking platforms can work together. Taxi, rental and car-sharing companies already handle many of these tasks. What would it take to turn that experience into an autonomous fleet business?
For a taxi fleet owner, autonomous vehicles may seem to remove the most important part of the current business – the driver. But even without drivers, someone still needs to take care of the cars. They need to be owned or financed, charged, cleaned, inspected and repaired. Someone also needs to manage depots, deal with incidents, help customers and make sure enough cars are available.
The first robotaxi services and tests in Europe are already showing how this could work. The company that develops the autonomous driving technology does not always own or operate the cars. The app where customers book their rides may come from another company too. This could leave an important role for taxi, rental, car-sharing and other fleet companies that already know how to manage vehicles.
A taxi company today manages both cars and drivers. Drivers need to be recruited, scheduled, paid and supported. With a driverless fleet, these tasks would eventually disappear, but most of the work related to the cars would stay.
Autonomous cars still need charging or refuelling, cleaning, tyres, inspections, repairs and insurance. They also need somewhere to park when they are not working. If there is an accident or a technical problem, someone needs to deal with it and get the car back on the road. Customer support is still needed too when there are problems with bookings or payments, or when someone leaves something in the car.
Some of these tasks may even become more important. Robotaxis are expensive, and every hour a car spends charging, being cleaned or waiting for maintenance is an hour when it cannot take passengers. Moove, for example, already provides fleet ownership, depots, charging, maintenance and 24/7 operations for autonomous vehicles.
Drivers also do more than drive: they notice damage, report faults, help passengers and respond when something goes wrong. Without a driver, these responsibilities need clear processes and dedicated support. Existing fleet experience is an advantage, but operators will need to adapt it to vehicles running without someone behind the wheel.
There can be several companies behind one robotaxi ride. One provides autonomous driving technology, another may own the cars, and a local company can take care of the fleet. A platform such as Uber can then connect the cars with passengers. Sometimes one company may do several of these things, but this is not always the case.
Zagreb is one example. Pony.ai provides the autonomous driving system, Verne owns and operates the fleet, and Uber connects it with customers through its app. Autonomous rides became commercially available through Uber in August 2026 with a licensed operator onboard. On 10 September, Pony.ai and Verne also started fully driverless passenger test rides on a 22-kilometre route connecting parts of Zagreb with the airport. These are still limited test rides, not a fully driverless service across the whole city.
A similar model is being tested in Madrid. WeRide, Uber and AVOMO received permission in September 2026 to start testing and mapping under Spain’s ES-AV framework. The first 20 vehicles have an onboard specialist. WeRide provides the autonomous technology, Uber connects the cars with passengers, and AVOMO takes care of fleet operations. Commercial operations are planned for later in 2026, but the current permit is for testing and preparation rather than a general driverless taxi service.
In London, Wayve and Uber launched supervised autonomous passenger rides in September 2026. Customers can be matched with an autonomous vehicle through the Uber app, but there is still a licensed driver in the car.
The plans for the next few years are already much bigger. Pony.ai and Uber announced in August 2026 that they plan to deploy more than 2,000 robotaxis in Europe, starting with Zagreb and later expanding to four more European cities.
Bolt and Lucid announced another partnership in September, with Bolt aiming to deploy at least 25,000 autonomous Lucid vehicles across European cities. This is a future target, not 25,000 cars already operating today.
How these fleets are owned and operated may also be different from one city to another. Local regulations, available vehicles, charging and depot infrastructure and partnerships will all have an effect on how each service is set up.
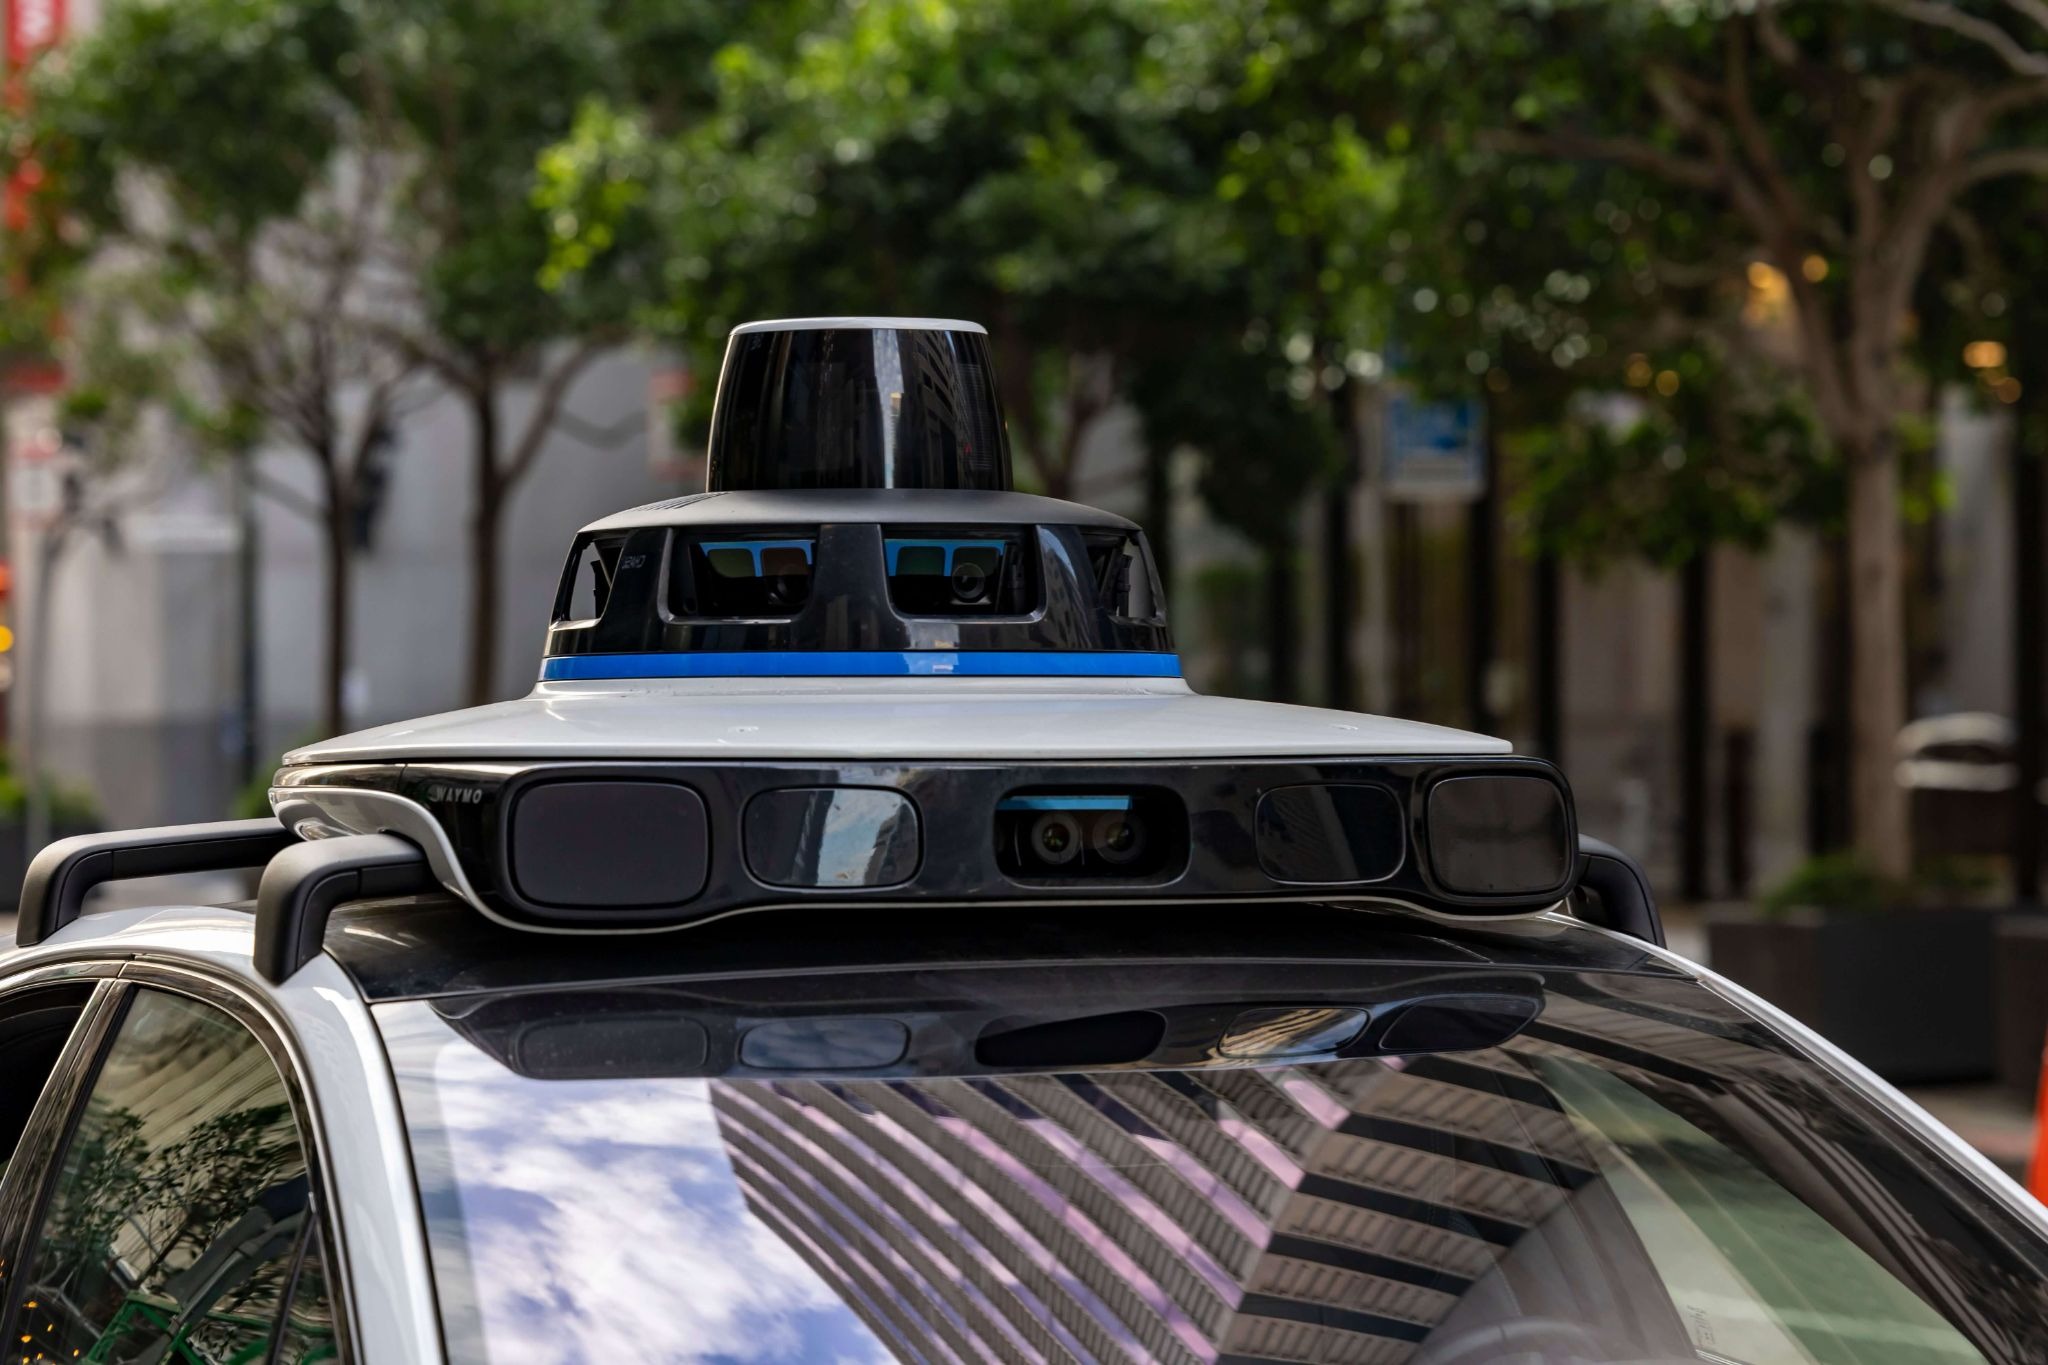
Taxi companies already do many of the things that would still be needed with an autonomous fleet. They maintain cars, deal with insurance and incidents, provide customer support and make sure enough vehicles are available. Some also already have their own depots, charging infrastructure or maintenance partners.
One possible model can already be seen in Zagreb. A local company owns and operates the autonomous fleet, while a larger ride-hailing platform brings customers. In the future, an existing taxi company could potentially have a similar role. Instead of managing cars and drivers, it could manage autonomous cars that receive bookings through a larger platform.
This does not mean platforms such as Uber will always rely on other companies to own the cars. Uber’s 2026 agreement with Rivian includes up to $1.25 billion in milestone-dependent investment and says that Uber or its fleet partners may purchase the autonomous vehicles. Uber is also developing infrastructure for autonomous fleets. Different ownership models are therefore possible.
Autonomous vehicles could also become interesting for rental and car-sharing companies, although this is probably further in the future. These businesses already manage vehicles, maintenance, cleaning, charging, bookings, customer accounts and payments, so much of the practical work is similar.
Autonomous driving could also change how rental and sharing cars are moved. Today, an employee may need to drive a car from one location to another. In the future, the vehicle could potentially do this itself within an area where autonomous driving is approved. It could even become possible for a rental car to drive itself to a customer’s pickup point.
Without drivers, it becomes especially important to understand how much time each vehicle is actually working. Every hour spent charging, being cleaned, waiting for maintenance or simply sitting unused means less time carrying paying passengers.
Some useful KPIs could be available hours per vehicle, paid trips per vehicle each day, revenue per available vehicle/day, empty kilometres, charging and maintenance downtime, cost per trip and incidents that need human help. These are most popular robotaxi industry KPIs of what a company could measure during a pilot.
For example, if cars spend too much time waiting to charge, the charging setup may need to change. A lot of empty kilometres could mean the cars are not in the right places, while too much maintenance downtime could make a vehicle more expensive to operate.
For either model, the business case depends on the partnership terms: who finances the vehicles, who carries the risk when demand is low, and how revenue and operating costs are shared. Operators should assess what remains after vehicle financing, insurance, charging, maintenance and partner fees. Depots, local service teams and reliable fleet availability could make an operator a valuable partner, but profitability still needs to be demonstrated.
One option for taxi fleets would be to work with an autonomous driving company and a larger ride-hailing platform. The local company could own or manage the cars and take care of the fleet, while customers book their rides through the larger platform.
Another option could be possible in cities where large ride-hailing platforms are not present or have limited coverage. A local company could work with an approved AV provider while using its own app, bookings, payments, customer support and fleet management.
In both cases, a company cannot simply buy autonomous cars and start offering rides. The technology needs to be approved, and local rules have to allow the service. These rules will also be different across Europe. Great Britain, for example, introduced its Automated Passenger Services permitting framework in 2026. Services similar to taxis or private hire vehicles need consent from the relevant local authority, while responsibility for the autonomous driving technology and the passenger service are treated separately.
A company does not need to have autonomous cars today to start preparing. A good first step is understanding the current fleet in detail – what each vehicle costs, how many hours it is available, how much time it spends charging or being repaired, and when cars are used the most.
Charging, cleaning, maintenance and depot processes are also worth looking at because all of these will still be needed with autonomous vehicles. A company interested in an AV pilot can then choose a location and use case, look at the local permit process and start talking to autonomous driving technology providers.
The software will also need some preparation. Customers still need to book and pay for rides, while the company needs fleet information, customer support, reporting and connections between its own systems and the AV technology. Starting with a small pilot makes it possible to test all of this before trying to build a larger service.
ATOM Mobility already provides many of the software functions used by taxi, ride-hailing, rental and sharing companies, including customer apps, bookings, payments, fleet management, maintenance tasks, analytics and APIs. Its ride-hailing software includes passenger and driver apps, dispatch, payments, fleet data, analytics and integrations. The ATOM Mobility API can also exchange data about vehicles, bookings, rides, payments, telemetry and maintenance tasks.
ATOM Mobility does not provide autonomous driving technology. This would come from a specialised AV company, and each project would have its own technical requirements and local approvals. For an AV pilot, ATOM Mobility could work with the fleet company and AV provider on the rider experience, integrations, fleet management and the data needed to measure how the pilot is working.
If you operate a taxi, rental or sharing fleet and want to explore an AV pilot, ATOM Mobility can help plan the booking and fleet-management setup, integrations and metrics you would need to test together with an AV technology partner.
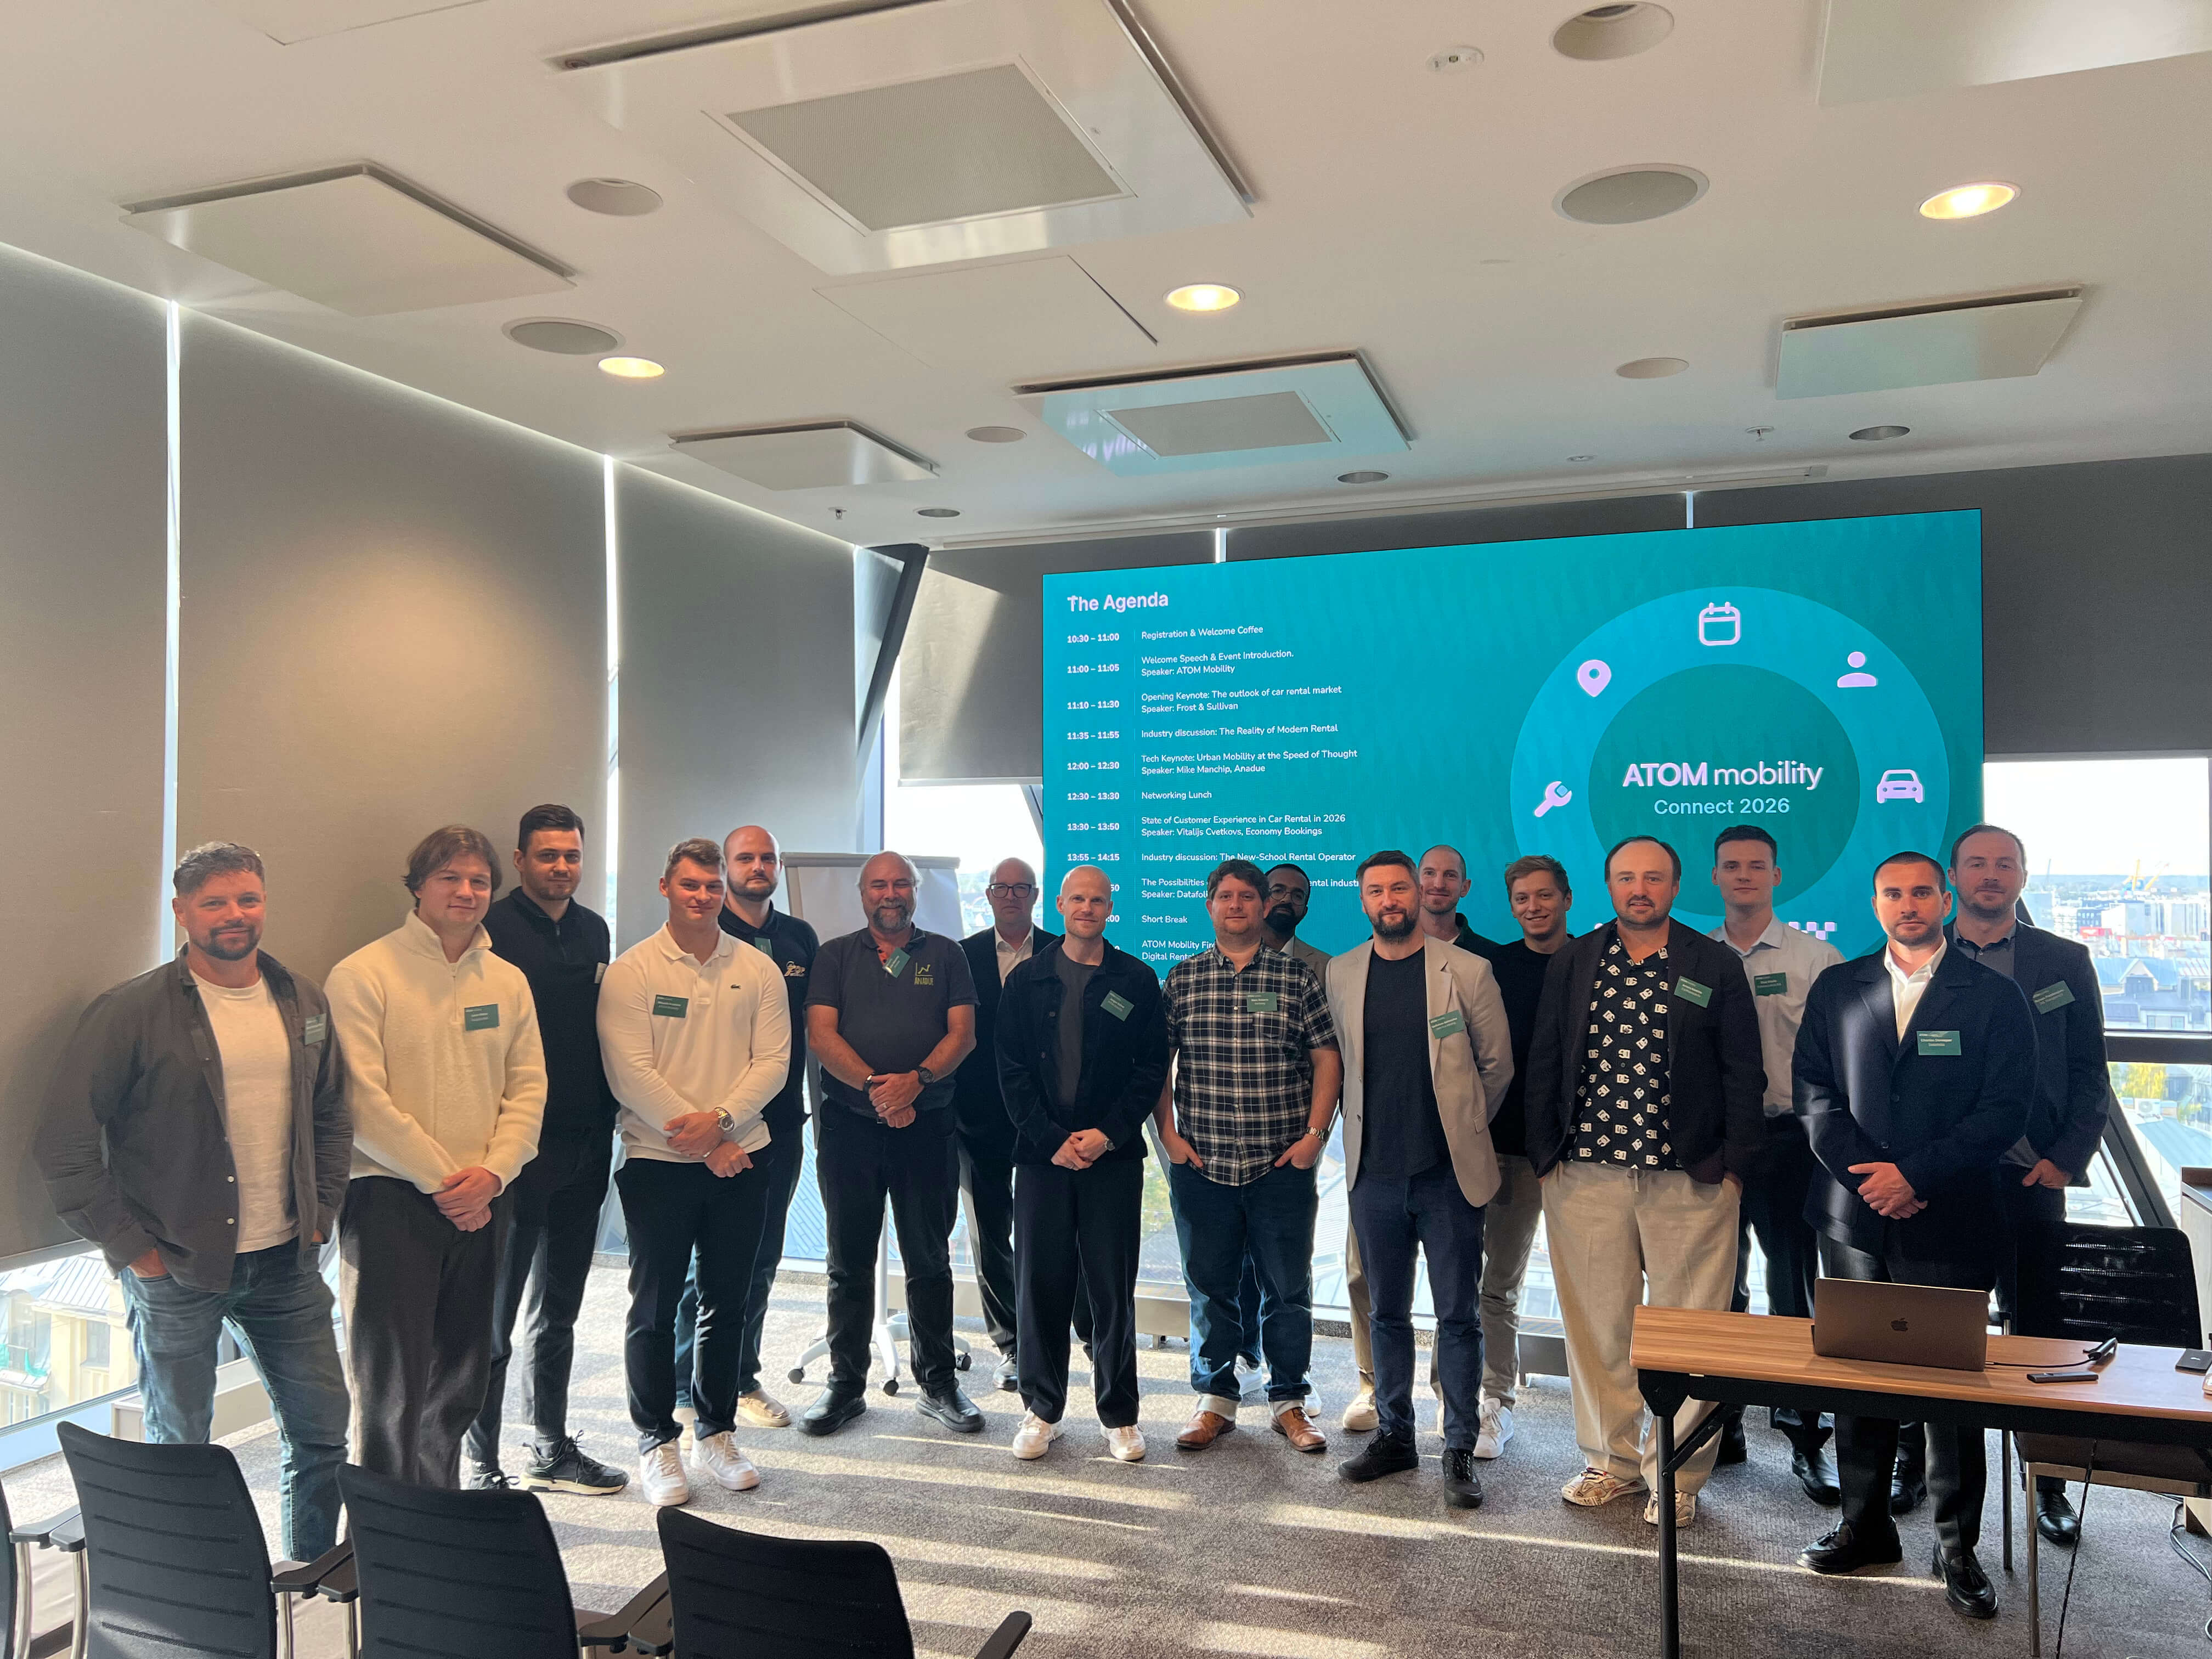
ATOM Connect Rental 2026 brought rental operators, aggregators, and technology partners together in Riga on October 8 to discuss the future of vehicle rental. Key topics included margin pressures, customer friction, data-driven fleet decisions, insurance, and keyless operations. The central takeaway: growth depends on improving customer experience and fleet efficiency, with practical steps operators can take today.
On October 8, 2026, we gathered on the panoramic top floor of the AC Hotel by Marriott in Riga for ATOM Connect Rental 2026.
Following the community-first approach of our past mobility summits, our goal for this edition was simple: avoid the noise, generic pitches, and sales booths of conventional trade shows. Instead, we brought together an intimate room of car rental operators, regional franchise managers, aggregators, and technology pioneers to have an open, unfiltered conversation about where vehicle rental is heading and what it actually takes to get there.
The day’s agenda reflected that intent. Rather than treating digitization as a buzzword, the sessions explored the operational realities of the industry: from global macroeconomic forces to the high-stakes friction points at the physical rental desk.
Here is a recap of the key discussions, industry data, and takeaways from the summit.
Opening the morning keynotes, Frost & Sullivan set the strategic foundation by examining how vehicle rental is shifting from an asset-heavy model to a digitally enabled, flexible mobility ecosystem.
Their analysis highlighted three forces currently reshaping the industry:
The main takeaway from their presentation was clear:
"The winners will not simply manage more vehicles - they will manage the customer, fleet, and ecosystem more intelligently."
Looking ahead, Frost & Sullivan stressed that future value will come from experience-led rental models (low-touch, personalized journeys), commercial and LCV subscriptions, and ecosystem partnerships that maximize revenue per vehicle, customer, and trip.
Following lunch, Vitalijs Cvetkovs, Head of Commerce at EconomyBookings.com, delivered a refreshingly candid, data-backed session on why car rental remains the most friction-heavy customer journey in travel.

While booking a flight or hotel is relatively straightforward, car rental forces the customer to decode dozens of brands, ACRISS vehicle codes ("or similar"), deposit rules, insurance tiers, and fuel policies. Drawing on data from over a million annual bookings, Vitalijs pinpointed the four friction points where the industry loses customers:
Vitalijs concluded with a crucial commercial insight: In the era of AI and instant review summaries, poor customer experiences are instantly visible. Customer experience is the only sustainable retention driver, and aggregators and operators must work together to absorb friction rather than pass it on to the traveler.
Beyond macro trends and customer journeys, the technical sessions focused on practical tools operators can deploy today:
Closing out the afternoon, ATOM Mobility hosted a fireside session with INVERS to discuss the nuts and bolts of deploying "digital rental-ready" fleets.
The session focused on practical execution. Using real-world examples, the discussion highlighted how telematics, CAN-bus hardware, and remote immobilizers enable traditional operators to launch virtual stations, service off-airport locations, and automate replacement vehicle workflows without increasing staff overhead.
The key takeaway: modernizing a fleet does not require an immediate, risky transition away from the counter. Hybrid operations allow established rental businesses to introduce 24/7 keyless handovers alongside their standard operations.
The Value of the Closed Room
As presentations concluded and conversations moved into the evening networking mixer overlooking Riga, the feedback mirrored what made previous ATOM Connect events special: the value is entirely in the room.
By capping attendance and curating an audience of active industry operators, conversations went deeper than high-level presentations. A sincere thank you to all our speakers, partners, and guests who joined us in Riga. The vehicle rental sector is evolving quickly, and we are proud to provide the space where the industry comes together to map out what comes next.
Stay tuned for our next ATOM Connect events by following us on LinkedIn!
%20(1).jpg)
🚗 Choosing car sharing software? Look beyond the rider app. Our checklist covers what to test in a demo, from keyless access and fleet operations to costs and support for both car sharing and digital rental.
Choosing car sharing software is more than choosing an app where customers can find and unlock a car. The same system has to verify drivers, take payments, communicate with vehicles, handle problems during a trip, and give your team the tools to keep cars available. The difference between two platforms often becomes clear only when something goes wrong: a customer cannot unlock a car, a payment fails, a vehicle needs to be taken out of service, or an operator wants to introduce advance bookings alongside short trips.
If you are comparing providers, ask them to show how these situations work in the actual product. Here is what to check.
“Car sharing” can mean several different things. A free-floating service lets customers find a nearby car and end a trip within an allowed area. A station-based service may require them to return the car to a specific location. Corporate fleets, peer-to-peer services, and self-service rentals have different booking, access, and approval rules.
Write down how your service will work before requesting demos:
Ask the provider to configure these rules in a demo. A platform that supports “car sharing” in general may still require development to support your exact model.
The app needs to do more than display vehicles on a map. Follow one booking from the first app open to the final receipt. Check registration, ID and driver's licence verification, vehicle discovery, booking, payment authorisation, keyless access, trip extension, damage reporting, and trip completion.
For advance rentals, check whether customers can book from your website as well as the app. Ask to see the complete web-to-app journey: selecting a vehicle and dates, confirming the reservation, and continuing to payment, licence verification, and vehicle access. Find out whether the website can complete the entire rental or whether customers must install the app after booking. ATOM Mobility's web-booker, for example, lets customers reserve on the web and then complete payment, and ID verification in the app.
Then test the exceptions. What does the customer see if verification fails, the car does not unlock, the vehicle is no longer available, or the payment cannot be collected? Can your support team see what happened and resolve it without contacting a developer?
This matters because customers judge the entire journey, including how quickly they can recover when a step fails.
Car sharing depends on reliable communication between the platform and the vehicle. Depending on the vehicle and hardware, this may include location, lock and unlock commands, mileage, fuel or battery level, and other status data. Ask for a list of supported telematics providers, rather than accepting a general statement that the platform is “hardware agnostic.” For your proposed fleet, establish:
Hardware flexibility is valuable when you expand or change suppliers, but the integration for the vehicles you plan to buy now is the first thing to verify.
The customer app gets the attention, but your team will spend much of its time in the management dashboard and operator tools. Ask a provider to show how staff:
Try these tasks with the roles your own team would use. The question is not only whether a feature exists, but how many manual steps it takes to run your fleet every day.
Car sharing and digital rental increasingly overlap. An operator might offer cars for short city trips and also accept bookings for a weekend. A rental business may begin with advance reservations and later add app-based, keyless access for shorter trips.
The technology shares many components, but the booking rules can differ. A rental may require advance pickup and return times, vehicle or category allocation, availability calendars, deposits, extensions, and different customer handover processes.
If you may operate both models, ask for a demonstration of both: an immediate hourly trip and an advance weekend booking. Check how the system prevents overlapping reservations, applies the correct pricing and deposit rules, and gives your team a clear view of availability. Also establish whether both models can use the same customer account and management setup, or whether additional products and fees are required.
ATOM Mobility supports vehicle sharing and digital rental on its platform. The useful question for any provider, including us, is how your exact combination of models would be configured and operated.
A low monthly licence fee can be attractive, but it may be only one part of the cost. Request a proposal that separates:
Launch, Setup, branding, app publication, migration, and training
Monthly minimums, fees per vehicle or booking, and included modules
Payment processing, refunds, deposits, and any additional transaction fees
Telematics hardware, installation, data plans, and new integrations
Ongoing work such as support level, custom development, and third-party services
Compare the likely cost at your launch fleet size and at a realistic larger fleet. Ask what happens if the fleet is seasonal or grows more slowly than planned.
Building in-house can make sense when a company has the engineering capacity and needs a customer experience or operating model that available platforms cannot support. It also means taking responsibility for project management, app updates, payments, vehicle integrations, security, monitoring, and support long after launch.
A white-label platform can shorten the route to market and spread that technical work across an established product. In return, you depend on the provider's supported features, integrations, development priorities, and service levels.
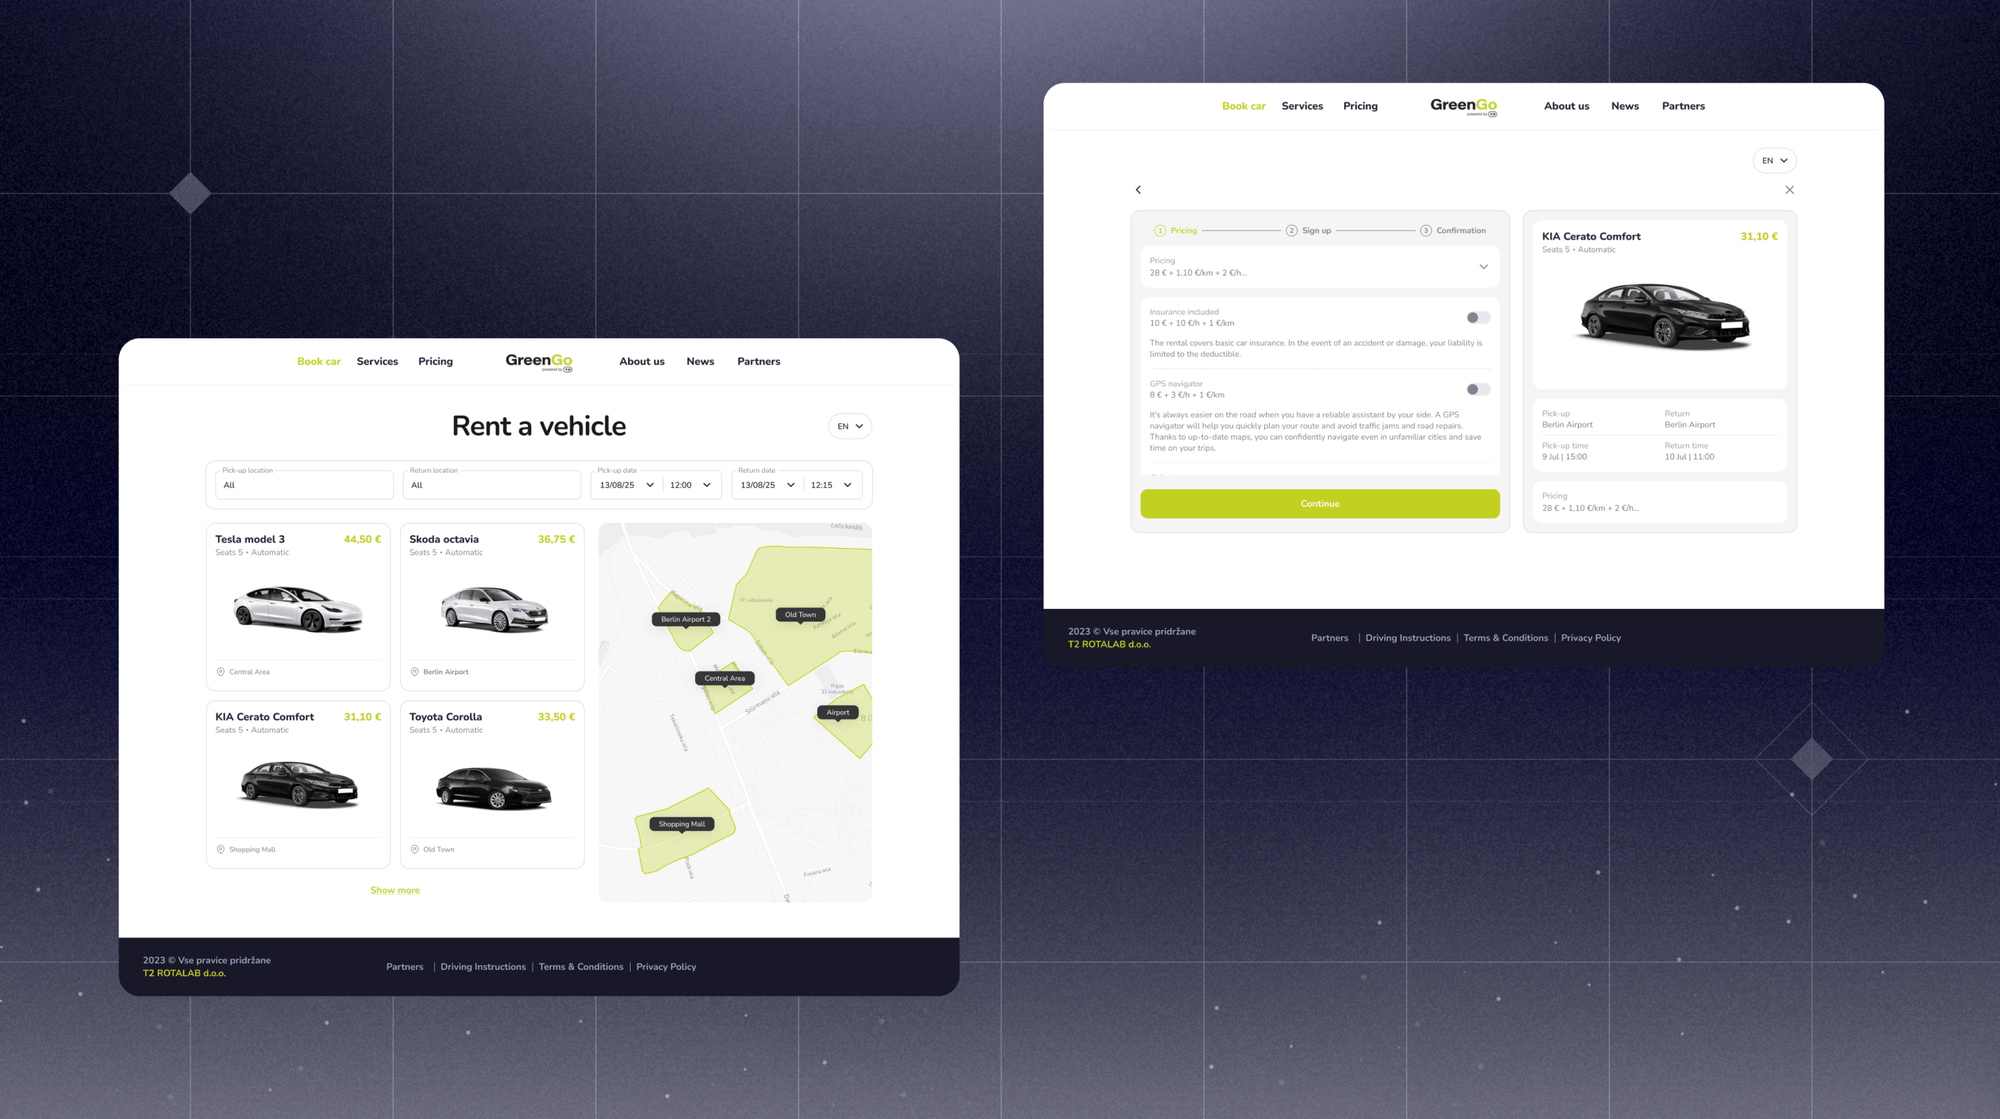
Slovenian car-sharing operator GreenGo initially spent two years developing its own app before switching to ATOM Mobility. Its experience shows why it is worth comparing the time and resources required to build with what an existing platform can already deliver. Read GreenGo's story: https://www.atommobility.com/blog/greengo-chooses-atom-mobility-to-power-its-electric-car-sharing-business
There is also a middle option: use a platform for core bookings, fleet management, and vehicle connectivity while building selected experiences or integrations yourself through APIs. If this is your plan, review the API documentation and confirm what your team can actually read, change, and automate.
Before signing, ask each shortlisted provider to demonstrate the same scenarios:
Use your intended vehicle models, payment markets, and operating rules in the discussion. For anything that cannot be shown, ask whether it is already available, needs configuration, requires paid development, or is only planned.
The best car sharing software is the one that supports your model reliably, gives your team control over daily operations, and leaves room for the business you intend to build next. A practical demo and a complete cost proposal will tell you more than a long feature list.
If you are evaluating car sharing alongside self-service rental, talk to ATOM Mobility about your fleet and operating model. We can show you how both models work on the platform and help you plan migration and scaling.
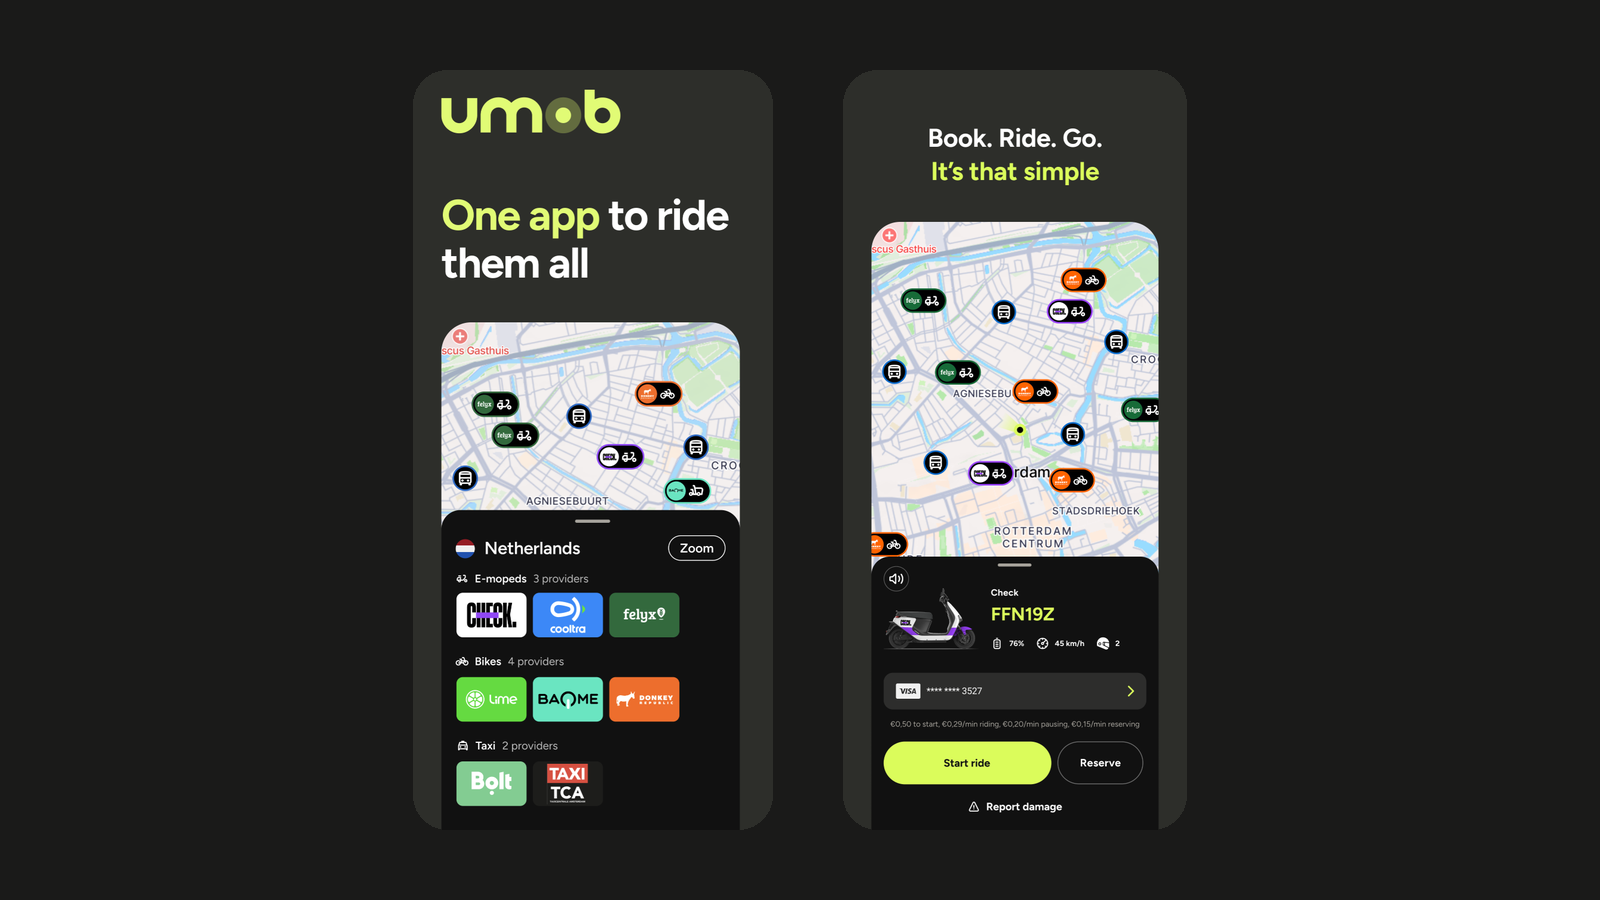
🌍 Reach more riders with ATOM Mobility and Umob. The integration gives shared mobility operators an additional distribution channel, helping attract new customers, generate more bookings and improve fleet utilization.
The future of mobility is not just about operating vehicles. It is about creating convenient journeys that bring different transportation options together in one simple customer experience.
That is why we are excited to highlight our partnership with Umob, helping mobility operators expand their reach and become part of a growing multimodal mobility ecosystem.
Whether you operate shared cars, scooters, bikes or mopeds through the ATOM Mobility platform, integrating with Umob allows your service to become accessible to thousands of Umob users looking for a convenient way to travel.
Today's users expect flexibility. They don't think in terms of individual mobility providers, they simply want the fastest, easiest, and most convenient route from A to B.
Umob brings different mobility providers and transport options together in one app. Users can find, compare, book and pay for different mobility options without having to download a separate app or create a new account for every provider.
By connecting your fleet to Umob, operators can:
For ATOM Mobility customers, the integration is designed to provide a straightforward way to unlock new distribution opportunities while continuing to manage their core operations through the ATOM Mobility platform.
Through the ATOM Mobility platform, participating operators can connect their fleets with Umob, enabling users to discover and use available vehicles directly through the Umob app.
Once connected, vehicles from participating operators can appear in Umob alongside other available mobility options, giving users one clear overview of the different ways they can get from A to B.
Users can discover an available vehicle, reserve and unlock it, start and end their ride, and pay directly through Umob.
The integration is designed to support:
Operators continue to manage their fleet, pricing, service areas and day-to-day operations through the ATOM Mobility platform, while Umob provides an additional channel through which users can discover and access their vehicles.
For mobility operators, connecting with Umob creates an additional distribution channel without changing the way they manage their day-to-day operations through ATOM Mobility.
By making vehicles available to thousands of Umob users, operators can increase their visibility at the moment people are actively looking for a ride. This creates the potential to attract new users, generate additional bookings and improve fleet utilization over time.
Every market is different, but many operators see MaaS partnerships as an important part of their long-term growth strategy.
One of the first ATOM Mobility operators to launch through the Umob integration is ZEUS Mobility, an ambitious European e-scooter sharing provider with a strong focus on innovation, a dynamic approach and challenging the established players in the market.
Fittingly, the partnership itself started through the ATOM Mobility network.
ZEUS and Umob first met at an ATOM Mobility event in Riga. While the initial introduction happened during the event, it was over drinks later that evening that the conversation really started.
ZEUS had already come across the Umob brand on mobility vehicles while travelling and had been impressed by the professional approach the company was taking. That recognition quickly turned into a conversation about how both companies could strengthen their propositions by working together.
From there, the integration moved forward quickly. ZEUS describes the preparation and integration process so far as “clean, professional and smooth.”
For ZEUS, the partnership creates an opportunity to strengthen the visibility of its brand, reach new customers and support its wider European growth ambitions.
Following its acquisition of Superpedestrian in May 2026, ZEUS is looking to accelerate its growth throughout 2026 and 2027, with the Umob partnership forming part of that ambition.
“ZEUS is thrilled to be partnering with Umob in European markets. Following our acquisition of Superpedestrian in May 2026, ZEUS is seeking to rapidly grow through 2026 and 2027. This partnership can help to drive this growth and reach new customers in new markets. We look forward to a rewarding partnership.” - Damian Young, ZEUS Mobility
One app to ride them all. Umob is an all-in-one mobility platform that brings different mobility providers and transport options together in one app.
Users can find, compare, book and pay for shared bikes, e-bikes, scooters, mopeds, public transport, taxis and other available mobility options through one account and one payment experience. Instead of downloading and registering with a separate app for every provider or every new city, users can open Umob and see the available mobility options around them.
Today, Umob is available in 28+ countries and 300+ cities, giving thousands of users an easier way to access different forms of mobility both at home and while travelling.
Key facts
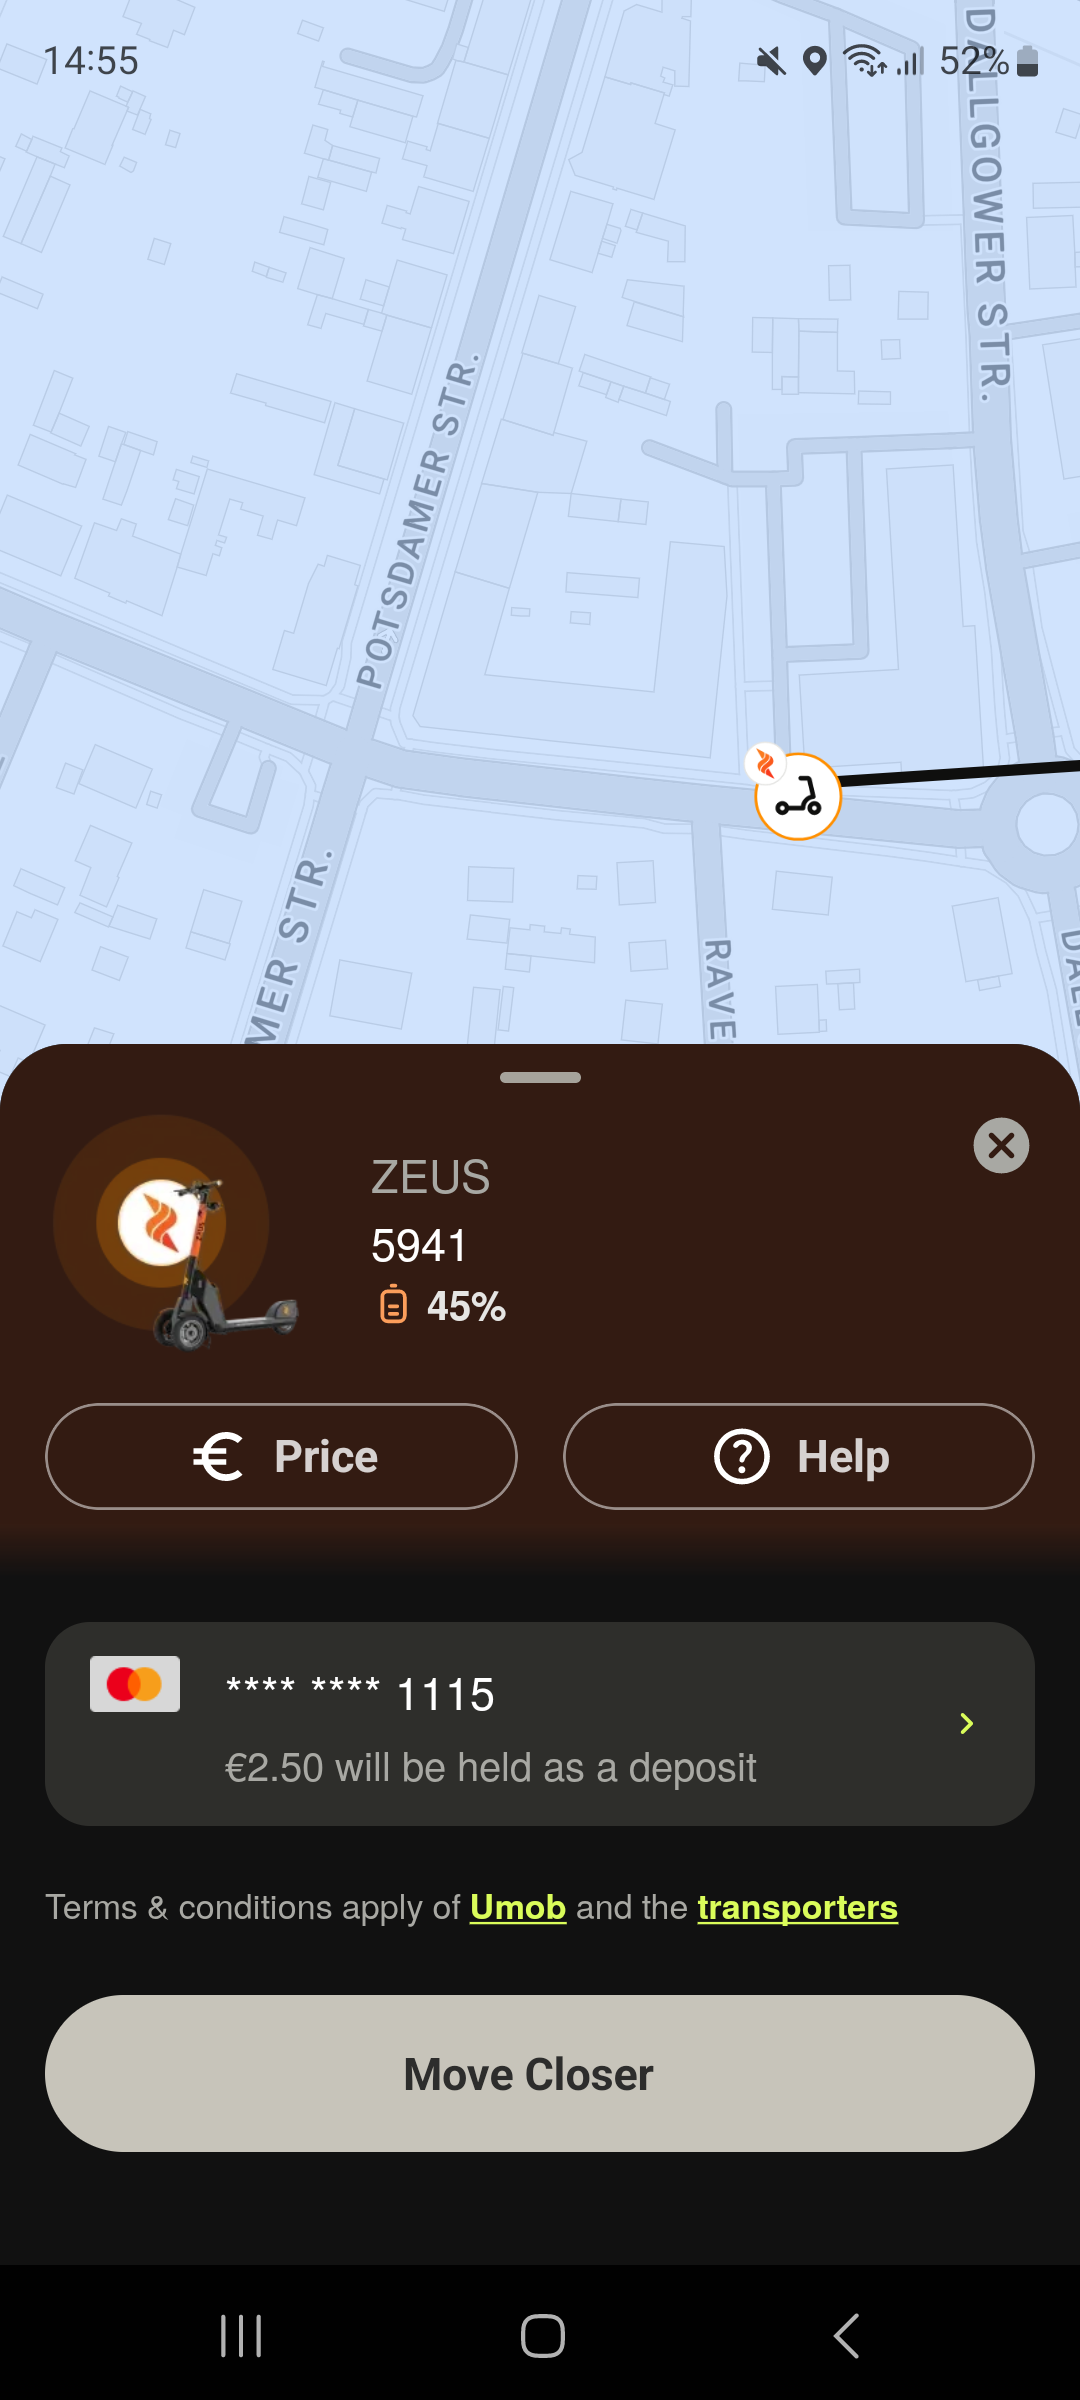
If you're already operating your shared mobility service on the ATOM Mobility platform, connecting with Umob could be the next step toward reaching more users and becoming part of a truly connected mobility ecosystem.
If you're interested in enabling the integration or learning more about how it works, get in touch with our team. We look forward to helping more operators connect, collaborate, and make sustainable mobility easier for everyone.
👷📊 ATOM Task Manager now goes beyond task distribution with new Shifts and Operator Performance functionality. Track shift routes, distance, completed tasks, time per task and individual operator performance - giving fleet managers a much clearer picture of field operations and efficiency.
Managing a large shared mobility or rental fleet isn't only about knowing which tasks were completed. It's also about understanding how efficiently field teams are working. We've significantly expanded ATOM Mobility Task Manager with new Shifts and Performance functionality, giving fleet managers much better visibility into operator activity, workload, routes and performance.
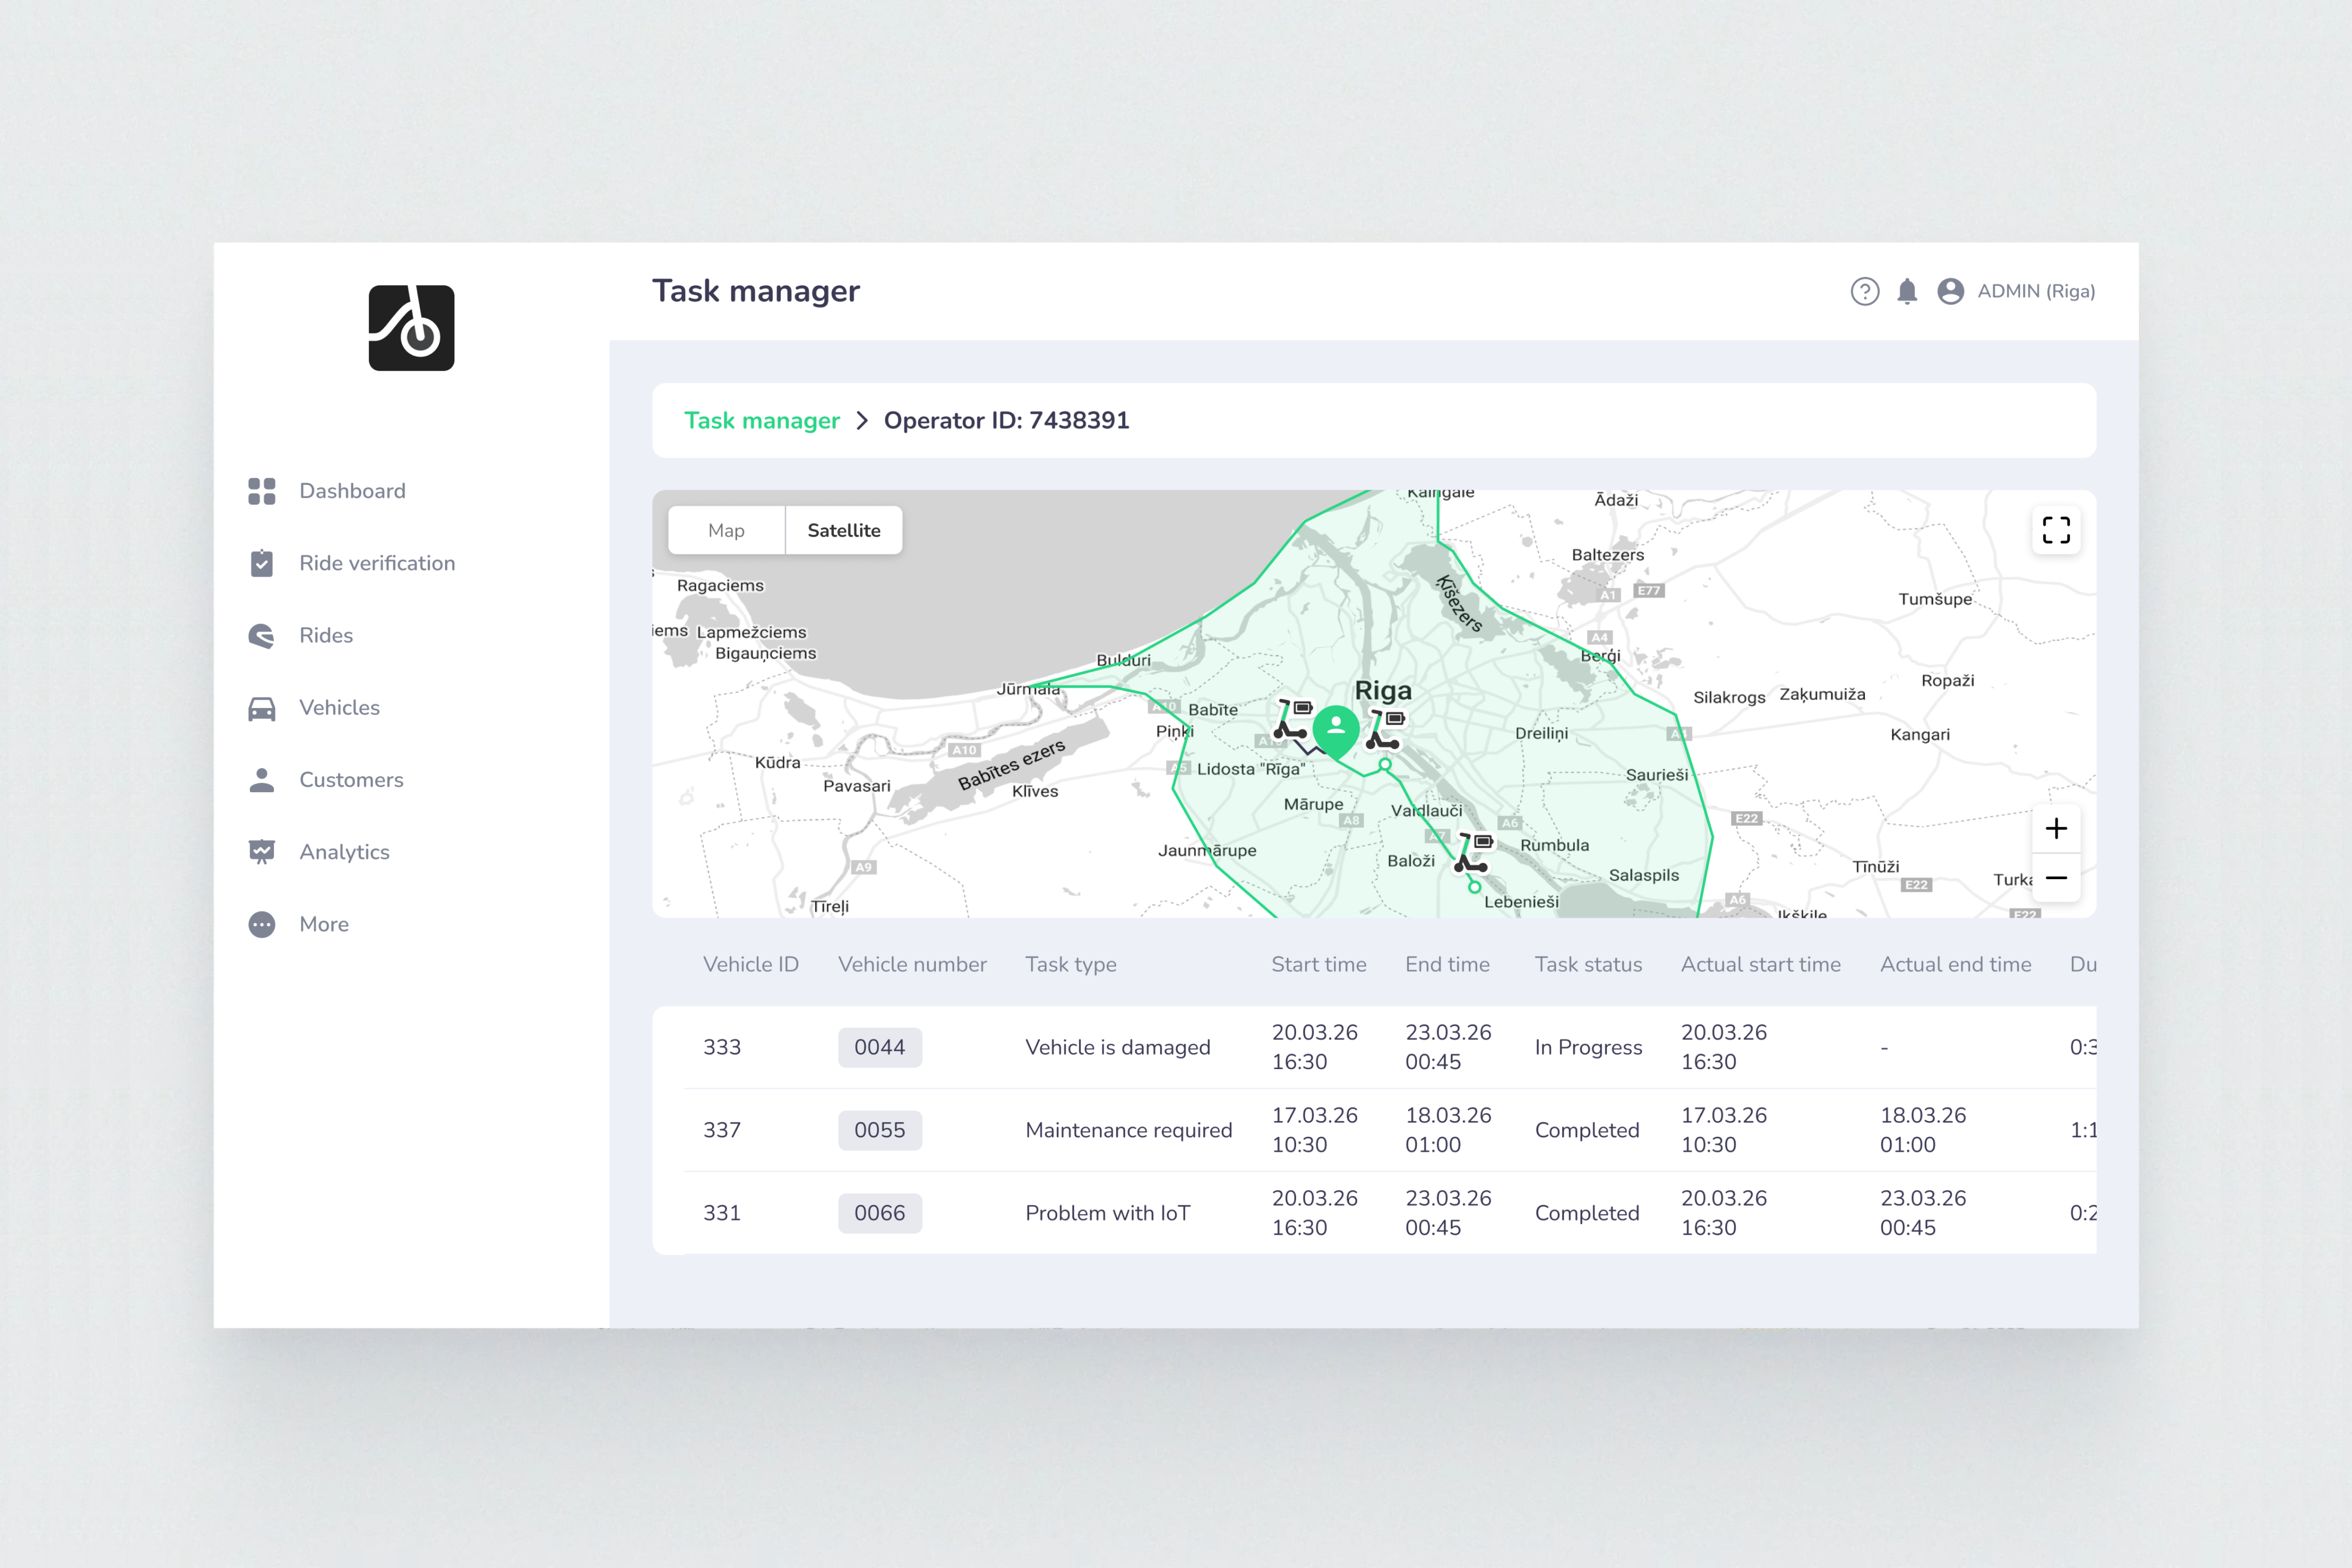
The new Shifts tab gives managers a centralized overview of all operator shifts, including:
Managers can open any individual shift to see the complete operational picture. For every task, you can see the vehicle, task type, planned start and deadline, actual start and completion times, status and total task duration.
Each shift also includes a map showing the operator's complete movement during the shift and where individual tasks were performed. For shifts currently in progress, managers can also see the operator's current location.
This makes it much easier to understand the actual route, workload and decisions behind each shift — and identify opportunities to improve how field teams manage fleet maintenance and operations.
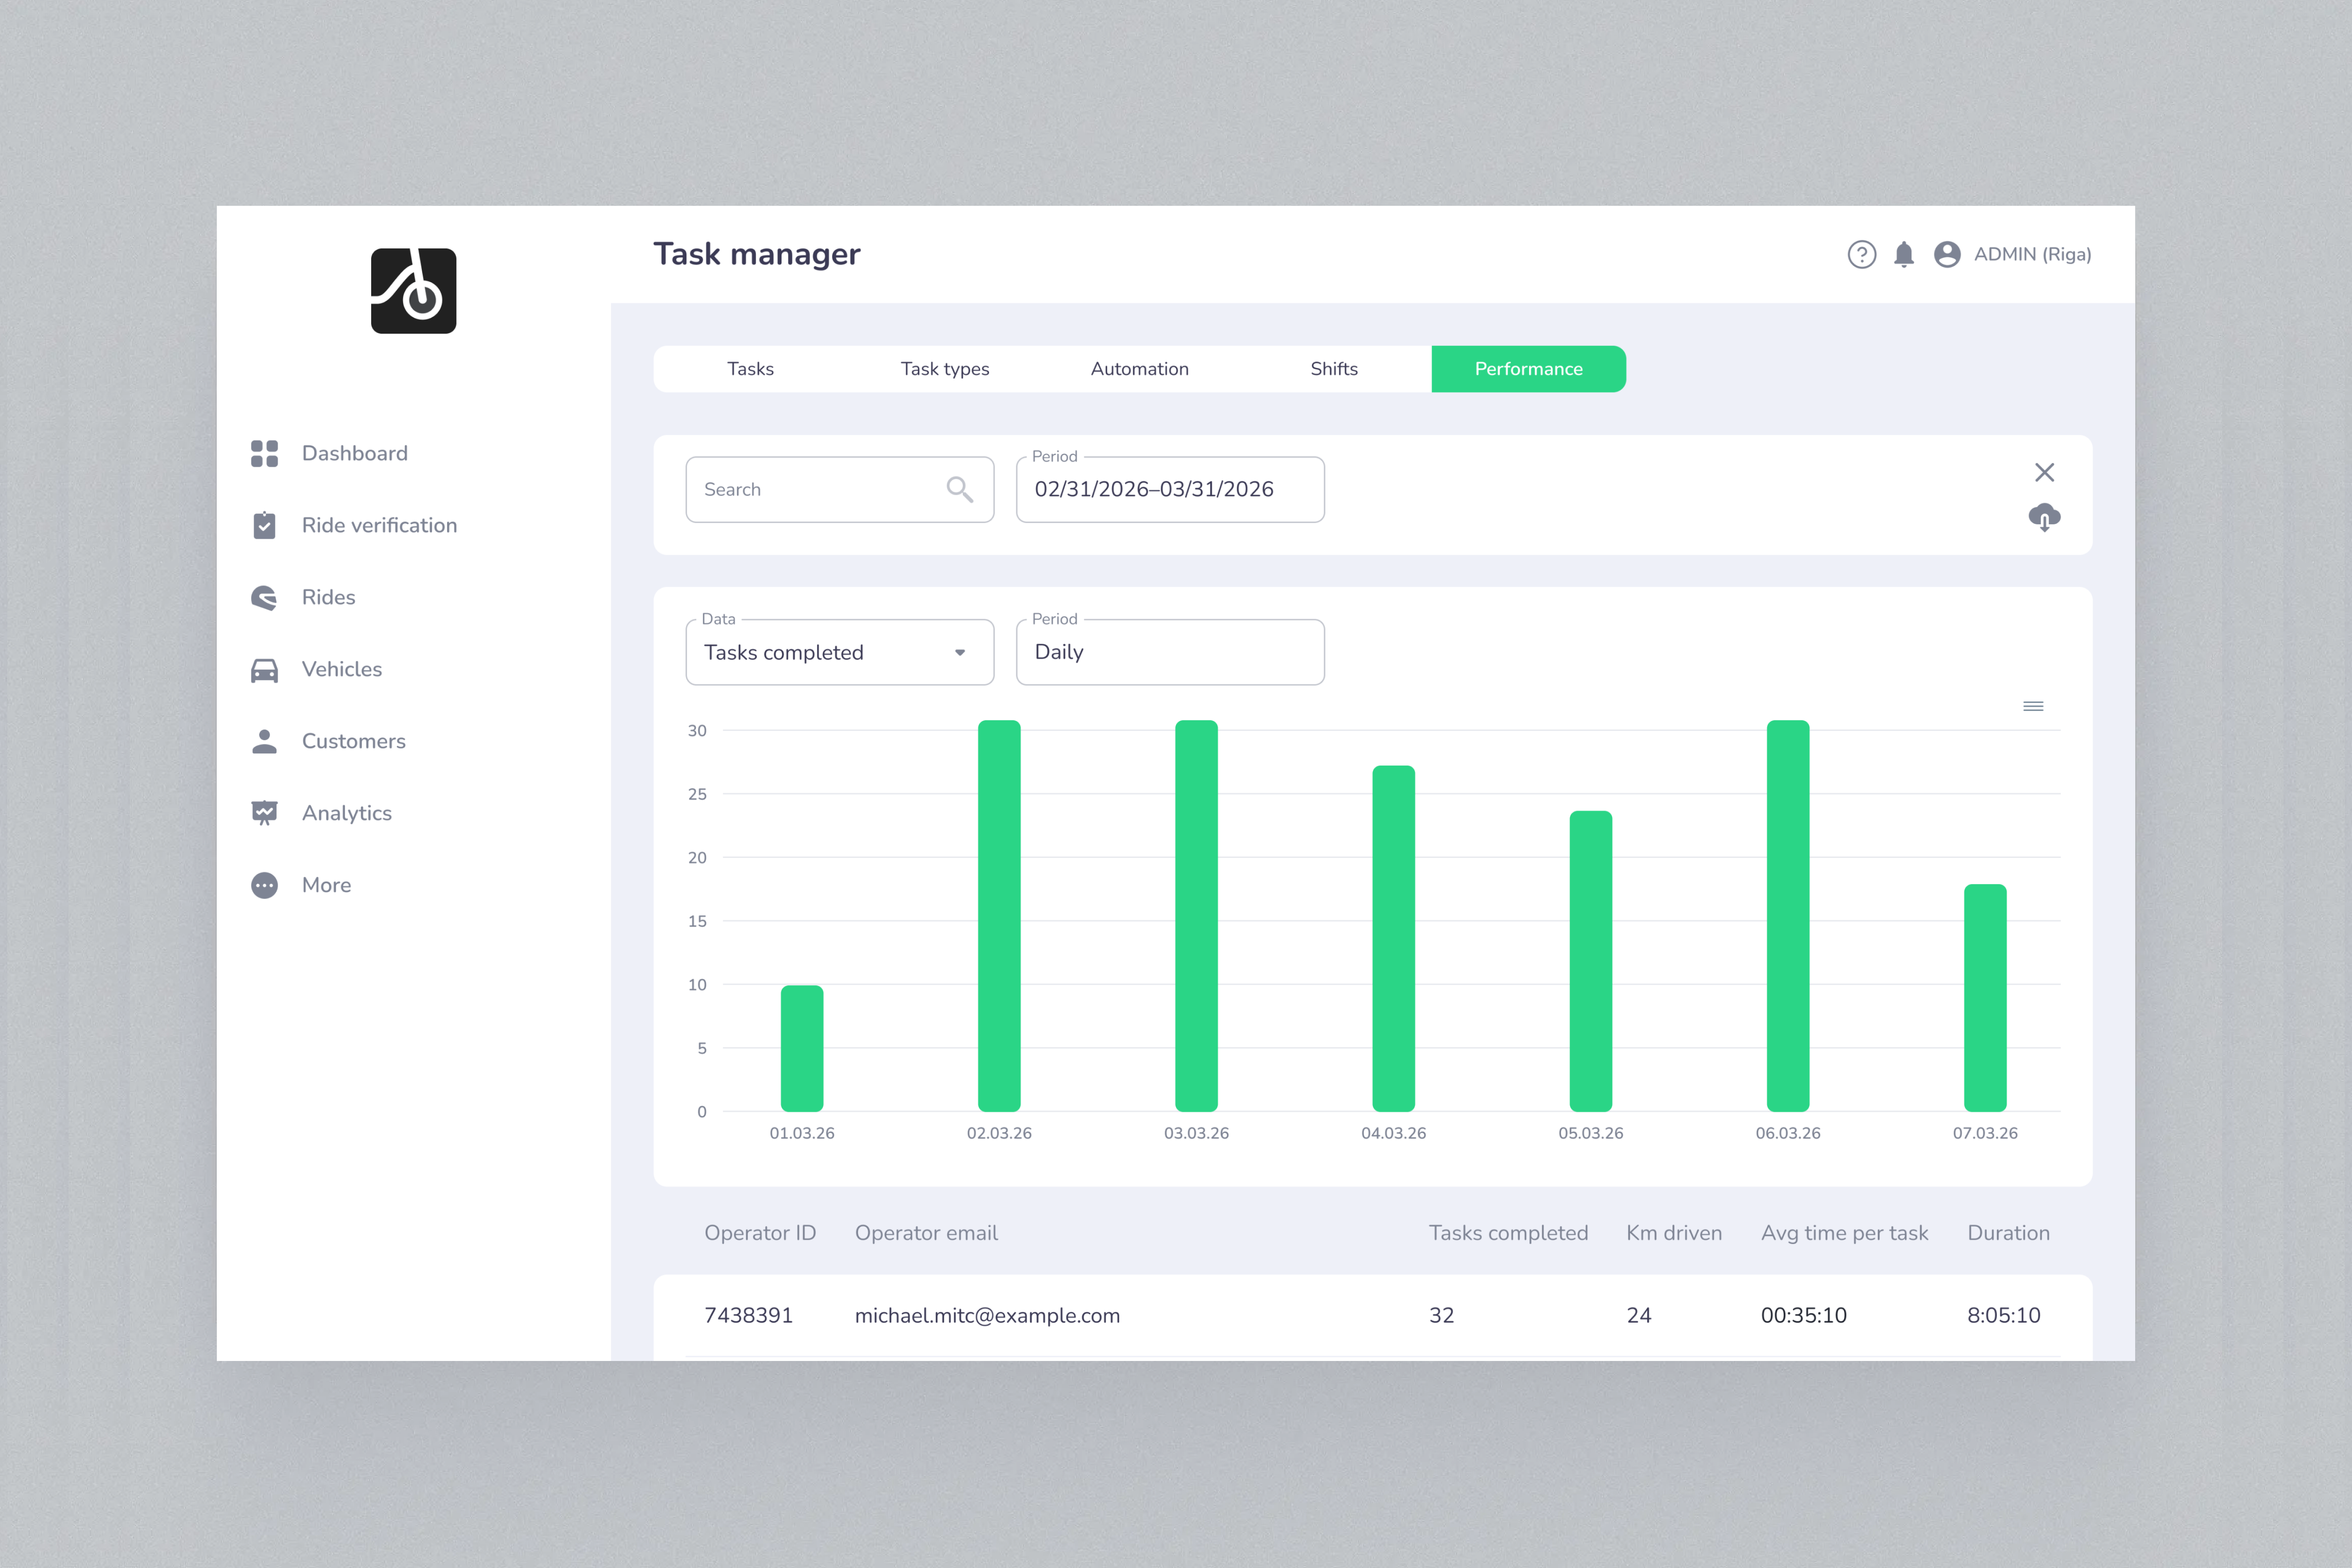
The new Performance tab aggregates operational results for every operator over a selected period.
Managers can track:
Instead of reviewing hundreds of individual tasks, managers can quickly compare operators, identify top performers and spot areas where additional training or operational improvements may be needed.
To make performance data accurate and useful, we've also introduced a new shift and task workflow in the ATOM Operator app. Operators now start and end their shifts directly in the app, while individual task start and completion times are recorded automatically.
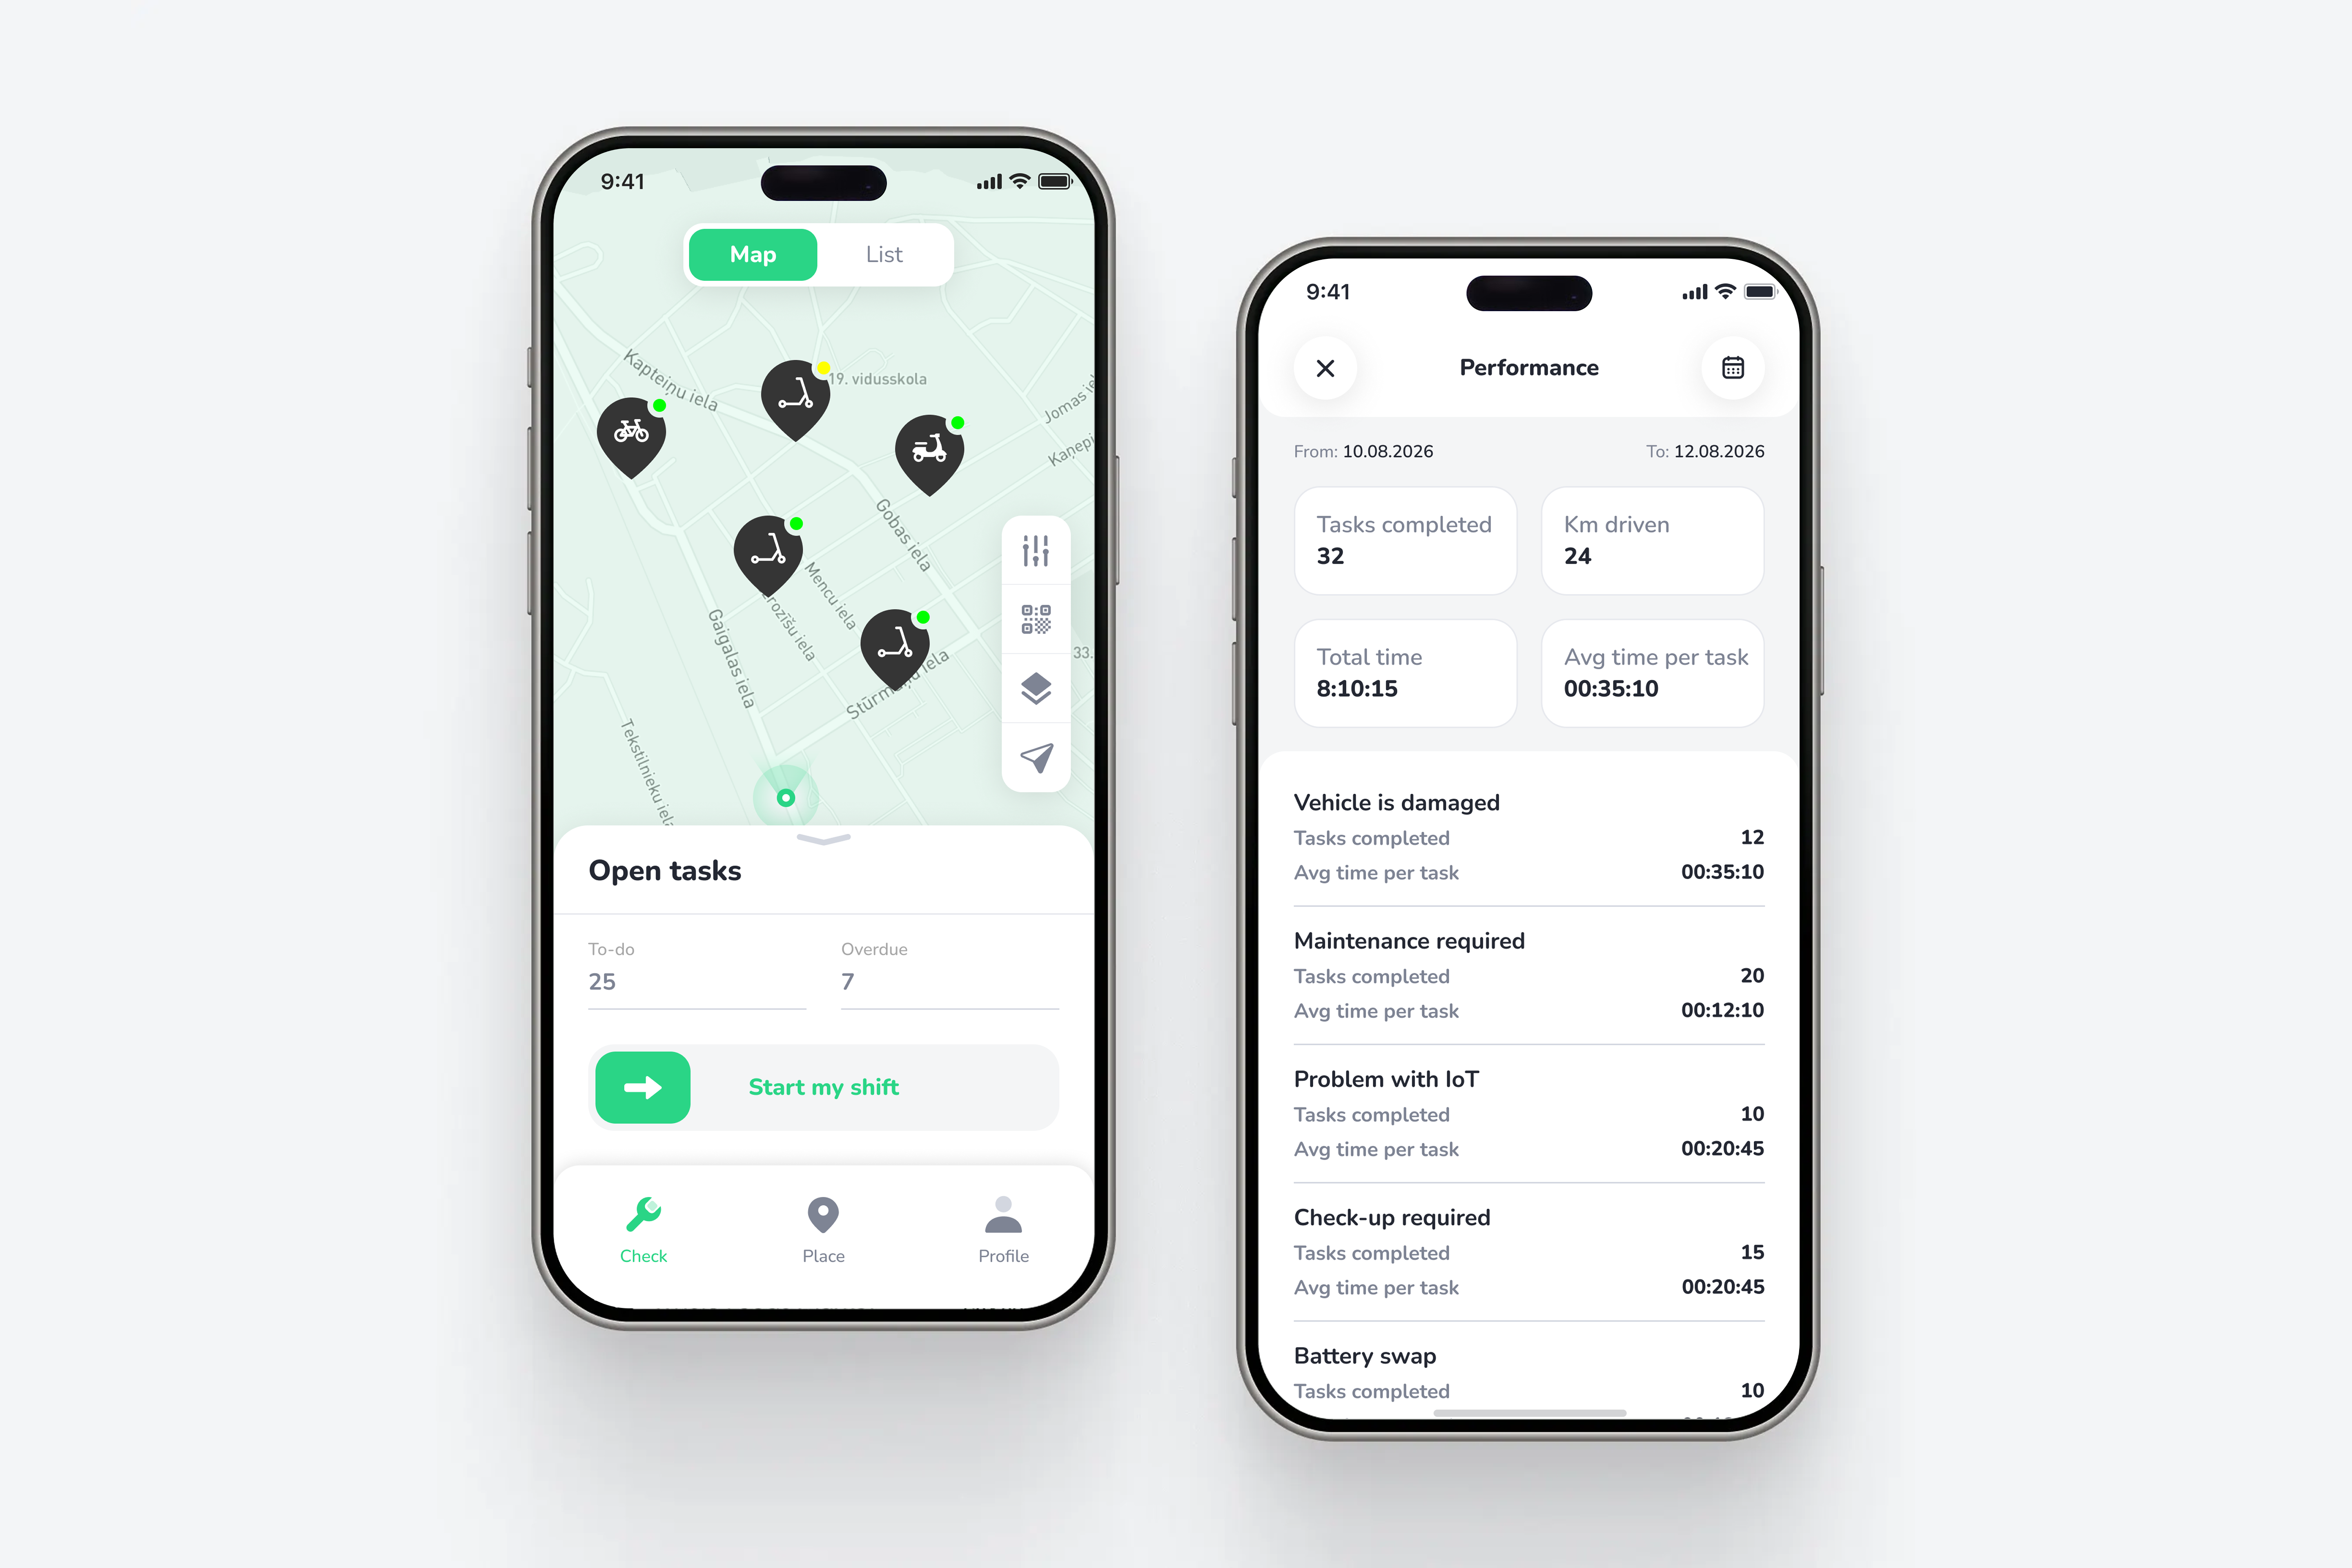
We've also added:
Together, these updates turn ATOM Task Manager from a task distribution tool into a much more complete field operations performance and optimization system. Operators get a clearer workflow and visibility into their own performance, while managers get the data they need to understand how their field operations actually work and where they can become more efficient.
The new functionality is available for ATOM Mobility's Vehicle sharing and Digital rental modules.
👉 Read more about our latest platform updates:
https://www.atommobility.com/atomupdates

"State of art technology in mobile apps and dashboard, very good SLA!"
"Easy, nice looking, continuously updated and developed every month and most of all very reliable with a extreme high uptime"
"We used to work with a different service provider which wasn't fitting our needs. Switching to ATOM was an improvement on our side"
Use test credentials to log in - Phone number: +1 123123123, Code: 777777


Driver App demo credentials - Email: test@atom.com, Password: driver